
File:CO2 responsibility 1950-2000.svg

原始文件 (SVG文件,尺寸为940 × 477像素,文件大小:1.98 MB)
摘要
| 描述 |
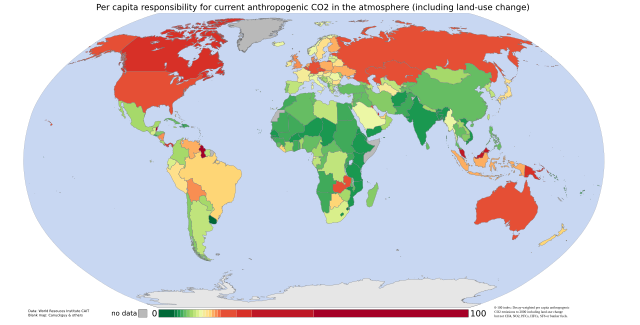
English: Cumulative per capita responsibility for anthropogenic CO2
Data from the World Resources Institute's CAIT 4.0 database (registration required). Includes CO2 emitted up to the year 2000 only (not CH4, N20, PFCs, HFCs or SF6). Estimates of the effects of land-use change are included; bunker-fuel emissions are not. The scale is a 0-100 decay-weighted index. The land-use estimates include the following (list from the relevant CAIT data note):
those of the original ecosystem
of forests in many tropical regions)
estimates include the emissions of carbon from wood products (burned, stored in longterm pools, decayed over time)
Also from the CAIT data note: "It is also important to note that the calculated flux of carbon does not explicitly include changes in carbon stocks that may result from various forms of management. Examples of what is not included are agricultural intensification, fertilization, the trend to no-till agriculture, thinning of forests, changes in species or varieties, and other silvicultural practices." And the data note warns that "these estimates of national sources and sinks of carbon from land-use change are uncertain on the order of +/- 150% for large fluxes, and +/- 50 MtC/yr for estimates near zero." So CAIT's land-use estimates are a bit wild. They are, however, the best currently available at a national level. |
| 日期 | 05/9/07 |
| 来源 | self-made using data from the World Resources Institute and a blank map by Canuckguy and others |
| 作者 | Vinny Burgoo |
许可协议

|
已授权您依据自由软件基金会发行的无固定段落及封面封底文字(Invariant Sections, Front-Cover Texts, and Back-Cover Texts)的GNU自由文件许可协议1.2版或任意后续版本的条款,复制、传播和/或修改本文件。该协议的副本请见“GNU Free Documentation License”。 |
| 本文件采用知识共享署名-相同方式共享 3.0 未本地化版本许可协议授权。 | ||
| ||
| 本许可协议标签作为GFDL许可协议更新的组成部分被添加至本文件。 |
文件历史
点击某个日期/时间查看对应时刻的文件。
| 日期/时间 | 缩略图 | 大小 | 用户 | 备注 | |
|---|---|---|---|---|---|
| 当前 | 2007年9月4日 (二) 23:22 | | 940 × 477(1.98 MB) | Vinny Burgoo | {{Information |Description='''Cumulative per capita responsibility for anthropogenic CO2''' Data from the World Resources Institute's [http://cait.wri.org/ CAIT 4.0 database] (registration required). Includes CO2 only (not CH4, N20, PFCs, HFCs or SF6). E |
文件用途
以下页面使用本文件:
全域文件用途
以下其他wiki使用此文件:
- ar.wikipedia.org上的用途
- bn.wikipedia.org上的用途
- bs.wikipedia.org上的用途
- ca.wikipedia.org上的用途
- cs.wikipedia.org上的用途
- da.wikipedia.org上的用途
- de.wikipedia.org上的用途
- en.wikipedia.org上的用途
- et.wikipedia.org上的用途
- eu.wikipedia.org上的用途
- fa.wikipedia.org上的用途
- fr.wikipedia.org上的用途
- gu.wikipedia.org上的用途
- ha.wikipedia.org上的用途
- he.wikipedia.org上的用途
- hi.wikipedia.org上的用途
- hy.wikipedia.org上的用途
- mk.wikipedia.org上的用途
- pnb.wikipedia.org上的用途
- pt.wikipedia.org上的用途
- ru.wikipedia.org上的用途
- so.wikipedia.org上的用途
- ta.wikipedia.org上的用途
- th.wikipedia.org上的用途
- uk.wikipedia.org上的用途
- ur.wikipedia.org上的用途
- vi.wikipedia.org上的用途