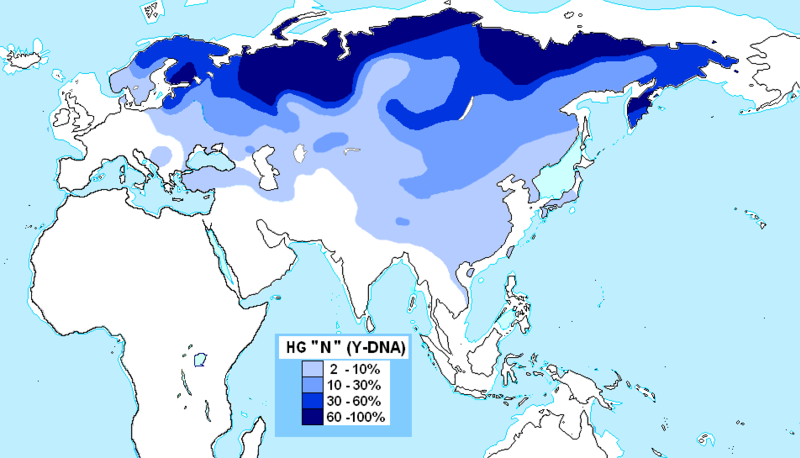
File:Haplogrupo N (ADN-Y).PNG

本预览的尺寸:800 × 458像素。 其他分辨率:320 × 183像素 | 640 × 366像素 | 953 × 545像素。
原始文件 (953 × 545像素,文件大小:76 KB,MIME类型:image/png)
文件历史
点击某个日期/时间查看对应时刻的文件。
| 日期/时间 | 缩略图 | 大小 | 用户 | 备注 | |
|---|---|---|---|---|---|
| 当前 | 2022年4月17日 (日) 08:58 |  | 953 × 545(76 KB) | Ebizur | Haplogroup N-M231 is found in greater than 10% of the population in the whole of Gansu Province in northwestern China. |
| 2022年4月17日 (日) 08:51 |  | 953 × 545(76 KB) | Ebizur | Haplogroup N-M231 is found in more than 2% and less than 10% of the population in every province of China except Gansu, where it is found in more than 10% of the population. | |
| 2021年1月8日 (五) 16:58 |  | 953 × 545(77 KB) | ABCymta | adding Aomori at 7%, Kalmyks at 10,7% and Kazakh tribes Qypshaq 10.3%, Jalair 10.9%, Qozha 16.7%, Syrgeli 65.6%. Tibetans at 5,6%. | |
| 2021年1月2日 (六) 17:14 |  | 953 × 545(72 KB) | Maulucioni | Revised data from Japan (according to Nonaka 2007), Guangxi Zhuang (Chen 2006), Tatars, Dolgans (Tambets 2004), Khakasia (Illumäe 2016), Kamchatka (Lell 2001), Finland (Lappalainen 2008) | |
| 2021年1月2日 (六) 04:32 |  | 953 × 551(65 KB) | Maulucioni | Data for Siberia, Uzbekistan, Turkmenistan, Xinjiang, southern China, and Hungary are overestimated, while data for European Russia, Serbia, and Sweden are underestimated. Reverted to version as of 04:30 20 oct 2011 (UTC) | |
| 2020年4月13日 (一) 02:17 | 1,232 × 498(112 KB) | Ebizur | Edited map to more accurately portray the frequency of Y-DNA Haplogroup N in present-day populations of the Baltic and Eastern Europe. | ||
| 2020年2月6日 (四) 17:07 | 1,232 × 498(114 KB) | LenguaMapa | Reverted to version as of 15:07, 6 February 2020 (UTC) for now, several studies have different results. I will try to combine the results and use a more "wide resource" | ||
| 2020年2月6日 (四) 16:22 | 1,232 × 498(112 KB) | LenguaMapa | slightly corrected distribution in europe/anatolia and korea as well as southern central asia (as in map before) | ||
| 2020年2月6日 (四) 15:07 | 1,232 × 498(114 KB) | LenguaMapa | fixed India (see my last comment) | ||
| 2020年2月6日 (四) 11:33 | 1,232 × 498(114 KB) | LenguaMapa | Reverted to version as of 21:18, 19 January 2020 (UTC) I will in some hours fix the part on Northern India. Afghanistan and Europe is so more correct. (Regarding India I will include another reference.) |
文件用途
全域文件用途
以下其他wiki使用此文件:
- azb.wikipedia.org上的用途
- en.wikipedia.org上的用途
- es.wikipedia.org上的用途
- fi.wikipedia.org上的用途
- fr.wikipedia.org上的用途
- ja.wikipedia.org上的用途
- ko.wikipedia.org上的用途
- mk.wikipedia.org上的用途
- no.wikipedia.org上的用途
- pl.wikipedia.org上的用途
- pt.wikipedia.org上的用途
- ru.wikipedia.org上的用途
- sk.wikipedia.org上的用途
- sr.wikipedia.org上的用途
- sv.wikipedia.org上的用途
- tr.wikipedia.org上的用途
- uk.wikipedia.org上的用途


