
File:Naa newspaper ad revenue.svg

此SVG文件的PNG预览的大小:511 × 335像素。 其他分辨率:320 × 210像素 | 640 × 420像素 | 1,024 × 671像素 | 1,280 × 839像素 | 2,560 × 1,678像素。
原始文件 (SVG文件,尺寸为511 × 335像素,文件大小:71 KB)
摘要
| 描述 |
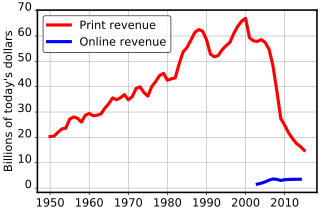
English: US newspaper advertising revenue, corrected for inflation |
| 日期 | |
| 来源 |
自己的作品 |
| 作者 | Dave Farrance |
| SVG开发 | 本矢量图使用Matplotlib创作。 |
| 源代码 | Python code#!/usr/bin/env python3
from matplotlib.pylab import *
print1950=[2070,2251,2464,2632,2685,3077,3223,3268,3176,3526,3681,3601,3659,
3780,4120,4426,4865,4910,5232,5714,5704,6167,6939,7481,7842,8234,9618,
10751,12213,13863,14794,16527,17694,20581,23522,25170,26990,29412,31197,
32368,32280,30349,30639,31869,34109,36092,38075,41330,43925,46289,48670,
44305,44102,44939,46703,47408,46611,42209,34740,24821,22795,20692,18931,
17300, 16400, 14870]
onlin2003=[1216,1541,2027,2664,3166,3109,2743,3042,3249,3340,3420,3500]
infla1950=[1.3,7.9,1.9,0.8,0.7,-0.4,1.5,3.3,2.8,0.7,1.7,1.0,1.0,1.3,
1.3,1.6,2.9,3.1,4.2,5.5,5.7,4.4,3.2,6.2,11.0,9.1,5.8,6.5,7.6,11.3,13.5,
10.3,6.2,3.2,4.3,3.6,1.9,3.6,4.1,4.8,5.4,4.2,3.0,3.0,2.6,2.8,3.0,2.3,1.6,
2.2,3.4,2.8,1.6,2.3,2.7,3.4,3.2,2.8,3.8,-0.4,1.6,3.2,2.1,1.5,1.6,0.1]
corr1950= array( [0.001]*len(infla1950) )
for j in range(len(corr1950) - 2, -1, -1):
corr1950[j] = corr1950[j+1] * ((100.0 + infla1950[j+1]) / 100.0)
rc('axes', lw=2.0)
plot(range(1950, 1950 + len(print1950)), print1950 * corr1950,
'r-', lw=4.0, label='Print revenue')
plot(range(2003, 2003 + len(onlin2003)),
onlin2003 * corr1950[2003 - 1950: 2003 - 1950 + len(onlin2003)],
'b-', lw=4.0, label='Online revenue')
xticks(size=14.5)
yticks(size=14.5,va='baseline')
grid(lw=0.75)
ylabel("Billions of today\'s dollars", size=14.5)
rc('legend', fontsize=14.5, edgecolor="black"); legend(loc=2)
savefig('naa_newspaper_ad_revenue.svg')
show()
|
许可协议
With the proviso that some rights to the numerical source data may be retained by the Newspaper Association of America, I release the graph and its source program to the public domain.
我,本作品著作权人,特此采用以下许可协议发表本作品:
| 本作品采用知识共享CC0 1.0 通用公有领域贡献许可协议授权。 | |
| 采用本宣告发表本作品的人,已在法律允许的范围内,通过在全世界放弃其对本作品拥有的著作权法规定的所有权利(包括所有相关权利),将本作品贡献至公有领域。您可以复制、修改、传播和表演本作品,将其用于商业目的,无需要求授权。
|
文件历史
点击某个日期/时间查看对应时刻的文件。
| 日期/时间 | 缩略图 | 大小 | 用户 | 备注 | |
|---|---|---|---|---|---|
| 当前 | 2018年8月27日 (一) 18:37 | | 511 × 335(71 KB) | Farry | Correction to inflation calculation |
| 2018年8月27日 (一) 09:30 |  | 513 × 324(71 KB) | Farry | Increase font size for better appearance in thumbnails | |
| 2018年8月26日 (日) 17:06 |  | 512 × 325(67 KB) | Farry | Adjust aspect-ratio and border width | |
| 2018年8月26日 (日) 15:07 |  | 508 × 364(71 KB) | Farry | Data up to 2015 (last available as of 2018) | |
| 2013年5月29日 (三) 19:29 |  | 660 × 490(77 KB) | Farry | 2012 data added | |
| 2012年9月18日 (二) 14:00 |  | 656 × 488(81 KB) | Farry | User created page with UploadWizard |
文件用途
以下页面使用本文件:
全域文件用途
以下其他wiki使用此文件:
- ca.wikipedia.org上的用途
- en.wikipedia.org上的用途
- fi.wikipedia.org上的用途
- fr.wikipedia.org上的用途
- lt.wikipedia.org上的用途
- sr.wikipedia.org上的用途