
File:COVID-19 outbreak New York per capita cases map.svg

此SVG文件的PNG预览的大小:799 × 600像素。 其他分辨率:320 × 240像素 | 639 × 480像素 | 1,023 × 768像素 | 1,280 × 961像素 | 2,560 × 1,922像素 | 1,441 × 1,082像素。
原始文件 (SVG文件,尺寸为1,441 × 1,082像素,文件大小:372 KB)
摘要
| 描述 |
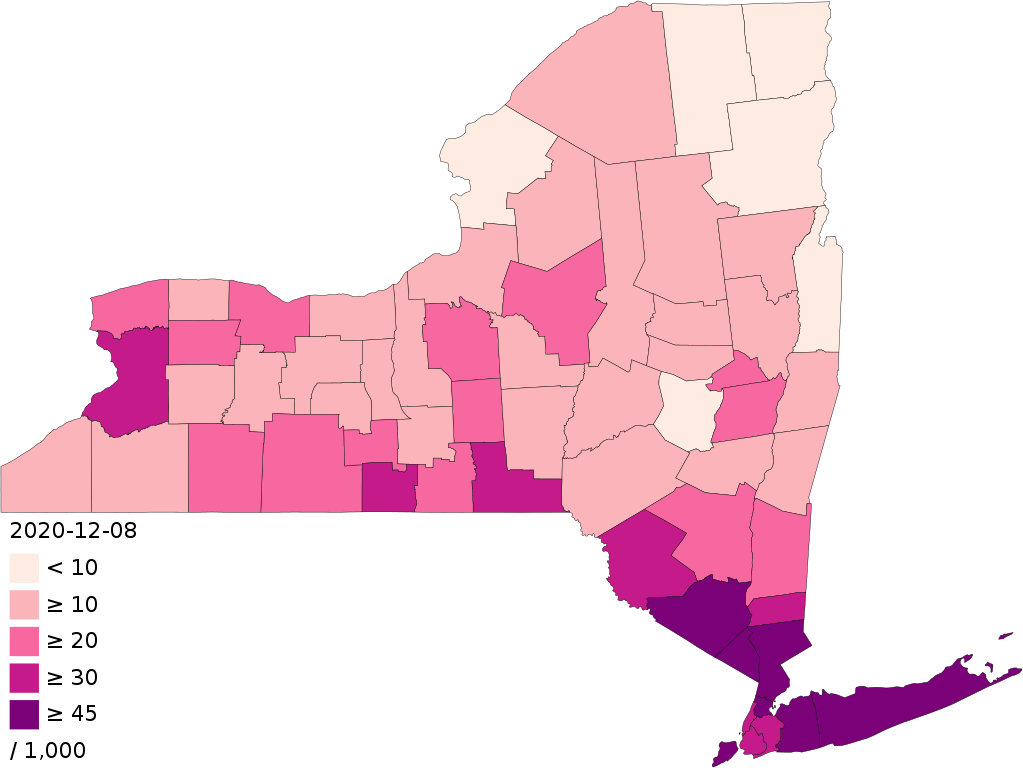
English: Confirmed cases of COVID-19 per 1,000 inhabitants in New York by county[1] |
| 日期 | |
| 来源 | 自己的作品; created using Python script |
| 作者 | Ythlev |
许可协议
我,本作品著作权人,特此采用以下许可协议发表本作品:
本文件采用知识共享署名-相同方式共享 4.0 国际许可协议授权。
- 您可以自由地:
- 共享 – 复制、发行并传播本作品
- 修改 – 改编作品
- 惟须遵守下列条件:
- 署名 – 您必须对作品进行署名,提供授权条款的链接,并说明是否对原始内容进行了更改。您可以用任何合理的方式来署名,但不得以任何方式表明许可人认可您或您的使用。
- 相同方式共享 – 如果您再混合、转换或者基于本作品进行创作,您必须以与原先许可协议相同或相兼容的许可协议分发您贡献的作品。
文件历史
点击某个日期/时间查看对应时刻的文件。
| 日期/时间 | 缩略图 | 大小 | 用户 | 备注 | |
|---|---|---|---|---|---|
| 当前 | 2020年12月10日 (四) 19:18 | | 1,441 × 1,082(372 KB) | TheNavigatrr | 12-08 |
| 2020年12月6日 (日) 05:23 |  | 1,441 × 1,082(372 KB) | TheNavigatrr | Update | |
| 2020年11月30日 (一) 02:05 |  | 1,441 × 1,082(372 KB) | TheNavigatrr | Updated for 11-28. | |
| 2020年11月20日 (五) 00:26 |  | 1,441 × 1,082(372 KB) | TheNavigatrr | Updated for 11-19. | |
| 2020年11月18日 (三) 03:56 |  | 1,441 × 1,082(372 KB) | TheNavigatrr | This revised color scale (in anticipation of larger spread in winter) shows the relative difference between Westchester/Rockland/Orange (which have >4% infection rates) and the boroughs of NYC. | |
| 2020年11月18日 (三) 03:48 |  | 1,441 × 1,082(372 KB) | TheNavigatrr | 11-17 update | |
| 2020年11月18日 (三) 03:38 |  | 1,441 × 1,082(372 KB) | TheNavigatrr | Uploaded a more recent version of this map. | |
| 2020年11月2日 (一) 23:09 |  | 1,441 × 1,082(371 KB) | TheNavigatrr | 11-02 | |
| 2020年10月31日 (六) 02:21 |  | 1,441 × 1,082(371 KB) | TheNavigatrr | 10-29 | |
| 2020年10月28日 (三) 21:13 |  | 1,441 × 1,082(371 KB) | TheNavigatrr | 10-28 |
文件用途
以下页面使用本文件:
全域文件用途
以下其他wiki使用此文件:
- cs.wikipedia.org上的用途
- id.wikipedia.org上的用途
- ru.wikipedia.org上的用途