
File:Solar Spectrum.png
此为最大尺寸。
Solar_Spectrum.png (800 × 595像素,文件大小:36 KB,MIME类型:image/png)
摘要
| 描述 |
[]
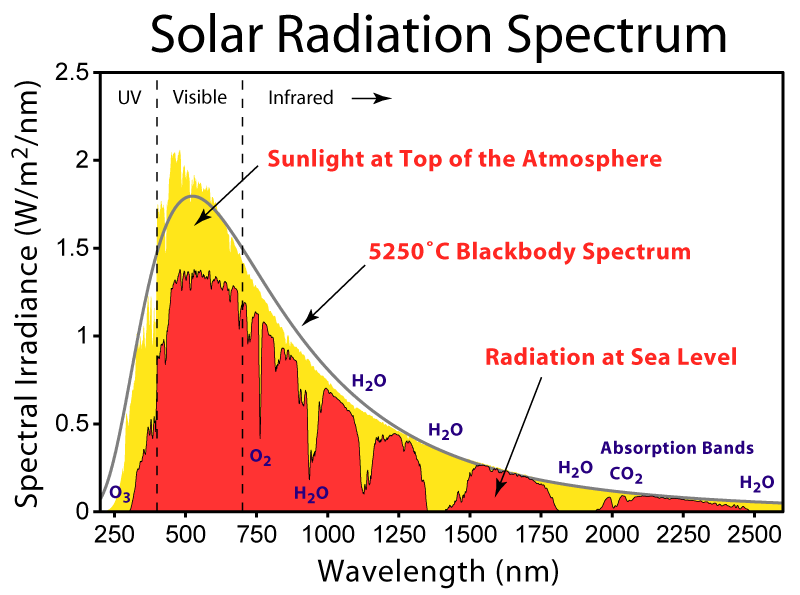
Čeština: Tento obrázek ukazuje spektrum slunečního záření pro přímé světlo jednak na horní hranici zemské atmosféry (reprezentované žlutou oblastí), tak na hladině moře (červená oblast). Slunce produkuje světlo s distribucí podobnou tomu, co by se dalo očekávat od černého tělesa o teplotě 5778 K (5505 °C), což je přibližně povrchová teplota slunce. Jak světlo prochází atmosférou, část je absorbována plyny se specifickými absorpčními pásy. Další světlo je redistribuováno Rayleighovým rozptylem, který je zodpovědný za modrou barvu atmosféry. Tyto křivky jsou založeny na terestrickém referenčním spektru Americké společnosti pro testování a materiály (American Society for Testing and Materials, ASTM), což jsou standardy přijaté fotovoltaickým průmyslem, které zajišťují konzistentní zkušební podmínky a jsou podobné světlu, které lze očekávat v Severní Americe. Zobrazují se oblasti pro ultrafialové, viditelné a infračervené světlo. English: This figure shows the solar radiation spectrum for direct light at both the top of the Earth's atmosphere (represented by the area in yellow) and at sea level (area in red). The sun produces light with a distribution similar to what would be expected from a 5525 K (5250 °C) blackbody, which is approximately the sun's surface temperature. As light passes through the atmosphere, some is absorbed by gases with specific absorption bands. Additional light is redistributed by Rayleigh scattering, which is responsible for the atmosphere's blue color.
These curves are based on NREL data for above the atmosphere and at sea level, which are standards adopted by the photovoltaics industry to ensure consistent test conditions and are similar to the light that could be expected in North America. Regions for ultraviolet, visible and infrared light are indicated. Español: La figura muestra el espectro de radiación solar de luz directa tanto arriba de la atmósfera de la Tierra (representada por el área en amarillo) como al nivel del mar (área en rojo). El sol produce luz con una distribución similar a la que se esperaría de un cuerpo negro a 5525 °K (5250 °C), que es latemperatura aproximada de la superficie del Sol. Conforme la luz pasa a través de la atmósfera, parte de la luz es absorbida por gases en bandas de absorción específicas. Luz adicional se redistribuye por dispersión de Rayleigh, la cual es responsable por el color azul de la atmósfera. Estas curvas están basadas en datos del NREL arriba de la atmósfera y al nivel del mar, los cuales son estándares adoptados por la industria fotovoltaica para asegurar condiciones de prueba consistentes, y son similares a la luz que se podría esperar en Norte América. Se indican las regiones de luz ultravioleta, visible e infrarroja. Français : Cette figure montre le spectre solaire pour la lumière directe à la limite supérieure de l'atmosphère terrestre (représentée par la zone jaune) et au niveau de la mer (zone rouge). Le Soleil produit une lumière dont la distribution est similaire à celle que l'on attendrait d'un corps noir à 5778 K (5505 °C), ce qui correspond approximativement à la température de surface du Soleil. Lorsque la lumière traverse l'atmosphère, une partie est absorbée par des gaz présentant des bandes d'absorption spécifiques. D'autres rayons sont redistribués par la diffusion de Rayleigh, ce qui explique la couleur bleue de l'atmosphère. Ces courbes sont basées sur le spectre terrestre de référence de l'American Society for Testing and Materials (ASTM). Il s'agit de normes adoptées par l'industrie photovoltaïque pour garantir des conditions d'essai cohérentes et similaires à la lumière à laquelle on peut s'attendre en Amérique du Nord. Les zones de lumière ultraviolette, visible et infrarouge sont indiquées. Italiano: La figura mostra lo spettro della radiazione solare per illuminazione diretta sia all'inizio che alla fine del'atmosfera terrestra. Il sole produce una luce con una distribuzione simile a quella che ci si attenderebbe da un corpo nero a 5525 K (5250 °C), che è approssimativamente la temperatura superficiale del sole. A mano a mano che la luce passa attraverso l'atmosfera, parte della radiazione è assorbita dai gas in specifiche bande di assorbimento. Un contributo additivo è dovuto allo scattering Raleigh, che è responsabile per il colore blu dell'atmosfera.
Le curve sono basate sugli spettri di riferimento dell'American Society for Testing and Materials (ASTM), che sono standard adottati dall'industria fotovoltaica per assicurare condizioni di prova consistenti e sono simili al tipo di radiazione che è possibile aspettarsi nell'America del nord. Sono indicate le regioni per l'ultravioletto, il visibile e la luce infrarossa Polski: Rozkład widmowy promieniowania słonecznego. Português: A figua mostra o espectro da radiação solar direta, tanto na parte mais alta da atmosfera terrestre (representado pela área em amarelo) como ao nível do mar (área em vermelho). O Sol emite radiação com uma distribuição similar ao que seria esperado de um corpo negro a 5778 K (5505 °C), que é a temperatura aproximada da superfície do Sol. À medida que a luz passa pela atmosfera terrestre, parte dela é absorvida por gases, com bandas de absorção específicas. A luz também é redistribuída por meio do fenômeno conhecido como Dispersão de Rayleigh, responsável pela cor azul da atmosfera. As curvas do gráfico são baseadas no Espectro de Referência Terrestre da American Society for Testing and Materials (ASTM), que são padrões utilizados pela indústria de fotovoltaicos para garantir condições de ensaio consistentes; portanto, as curvas são similares ao espectro esperado na América do Norte. Regiões para luz ultravioleta, visível e infravermelha estão indicadas. עברית : ספקטרום השמש מעל האטמוספירה ובגובה פני הים العربية : طيف الشمس المأخوذ بالقمر الصناعي (أصفر) وعلى الأرض (أحمر) بالمقارنة بطيف الجسم الأسود. ينطبق طيف القمر الصناعي مع النظرية. ويتخلل طيف الشمس المأخوذ علي الأرض بعض الفجوات الناتجة عن امتصاص جو الأرض لبعض ترددات الأشعة |
|||
| 日期 | ||||
| 来源 | 自己的作品 | |||
| 作者 | Robert A. Rohde | |||
| 其他版本 |
[]
|


This figure was prepared by Robert A. Rohde as part of the Global Warming Art project.
Image from Global Warming Art
This image is an original work created for Global Warming Art. Please refer to the image description page for more information.

|
已授权您依据自由软件基金会发行的无固定段落及封面封底文字(Invariant Sections, Front-Cover Texts, and Back-Cover Texts)的GNU自由文件许可协议1.2版或任意后续版本的条款,复制、传播和/或修改本文件。该协议的副本请见“GNU Free Documentation License”。 |
| 本文件采用知识共享署名-相同方式共享 3.0 未本地化版本许可协议授权。 | ||
| ||
| 本许可协议标签作为GFDL许可协议更新的组成部分被添加至本文件。 |
原始上传日志
| date/time | username | resolution | size | edit summary |
|---|---|---|---|---|
| 22:43, 9 June 2007 | w:en:User:Dragons flight | 800×595 | 37,125 | ({{GWArt}}) |
文件历史
点击某个日期/时间查看对应时刻的文件。
| 日期/时间 | 缩略图 | 大小 | 用户 | 备注 | |
|---|---|---|---|---|---|
| 当前 | 2007年8月25日 (六) 09:24 | | 800 × 595(36 KB) | BetacommandBot | Transwiki approved by: w:en:User:Dmcdevit This image was copied from wikipedia:en. The original description was: == Description == This figure shows the w:en:solar radiation spectrum for direct w:en:light at both the top of the [[w:en:Earth |
文件用途
全域文件用途
以下其他wiki使用此文件:
- ar.wikipedia.org上的用途
- be.wikipedia.org上的用途
- ca.wikipedia.org上的用途
- en.wikipedia.org上的用途
- en.wikibooks.org上的用途
- en.wikiversity.org上的用途
- es.wikipedia.org上的用途
- eu.wikipedia.org上的用途
- fa.wikipedia.org上的用途
- fi.wikipedia.org上的用途
- hak.wikipedia.org上的用途
- he.wikipedia.org上的用途
- it.wikipedia.org上的用途
- ja.wikipedia.org上的用途
- ka.wikipedia.org上的用途
- ko.wikipedia.org上的用途
- ro.wikipedia.org上的用途
- ru.wikipedia.org上的用途
- sh.wikipedia.org上的用途
- si.wikipedia.org上的用途
- sl.wikipedia.org上的用途
- sr.wikipedia.org上的用途
- th.wikipedia.org上的用途
- uz.wikipedia.org上的用途
- vi.wikipedia.org上的用途
- vls.wikipedia.org上的用途