
File:20201019 Levelized Cost of Energy (LCOE, Lazard) - renewable energy.svg

此 SVG 檔案的 PNG 預覽的大小:800 × 450 像素。 其他解析度:320 × 180 像素 | 640 × 360 像素 | 1,024 × 576 像素 | 1,280 × 720 像素 | 2,560 × 1,440 像素 | 1,200 × 675 像素。
原始檔案 (SVG 檔案,表面大小:1,200 × 675 像素,檔案大小:4 KB)
摘要
| 描述 |
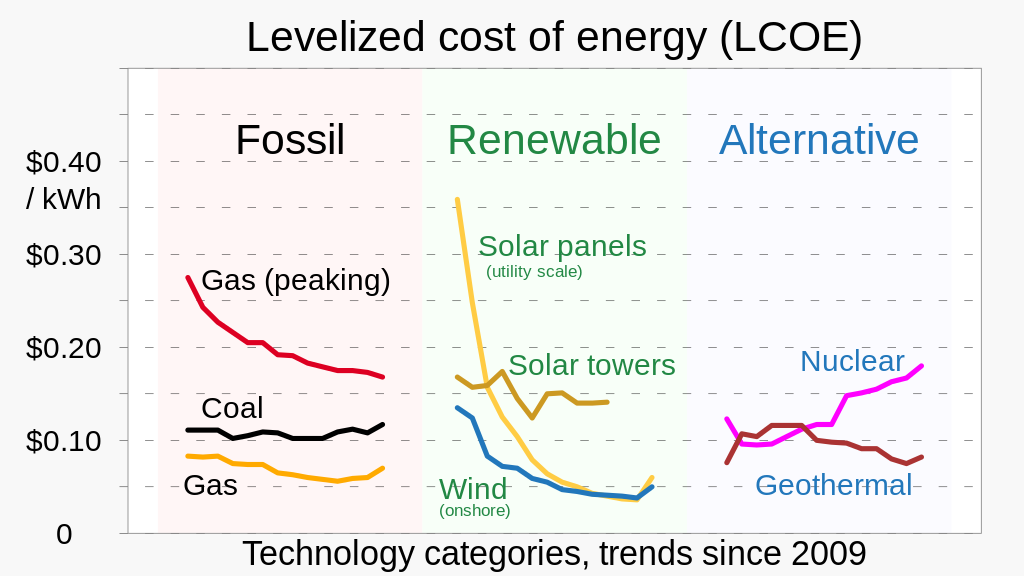
English: Graph of levelized cost of energy (starting with LCOE 14.0, October 2020) for various energy sources as a function of year, derived from LCOE data from Lazard
|
||
| 日期 | (date of Lazard LCOE report) | ||
| 來源 | 自己的作品 | ||
| 作者 | RCraig09 |
_-_renewable_energy.svg)
_-_renewable_energy.svg?uselang=zh-hant)
_-_renewable_energy.svg?uselang=zh-hant)
_-_renewable_energy.svg?action=history&uselang=zh-hant)
_-_renewable_energy.svg)
_-_renewable_energy.svg)
授權條款
我,本作品的著作權持有者,決定用以下授權條款發佈本作品:
此檔案採用創用CC 姓名標示-相同方式分享 4.0 國際授權條款。
- 您可以自由:
- 分享 – 複製、發佈和傳播本作品
- 重新修改 – 創作演繹作品
- 惟需遵照下列條件:
- 姓名標示 – 您必須指名出正確的製作者,和提供授權條款的連結,以及表示是否有對內容上做出變更。您可以用任何合理的方式來行動,但不得以任何方式表明授權條款是對您許可或是由您所使用。
- 相同方式分享 – 如果您利用本素材進行再混合、轉換或創作,您必須基於如同原先的相同或兼容的條款,來分布您的貢獻成品。
檔案歷史
點選日期/時間以檢視該時間的檔案版本。
| 日期/時間 | 縮圖 | 尺寸 | 使用者 | 備註 | |
|---|---|---|---|---|---|
| 目前 | 2023年9月3日 (日) 05:18 | | 1,200 × 675(4 KB) | RCraig09 | Version 6: change vertical scale so graphic fills plot area more completely . . . minor text changes |
| 2023年9月2日 (六) 16:36 |  | 1,200 × 675(4 KB) | RCraig09 | Version 5: change color behind "fossil" to distinguish from framing . . . change abbreviation to "kWh" | |
| 2023年9月1日 (五) 21:06 |  | 1,200 × 675(4 KB) | RCraig09 | Version 4: update to include more recent data; change form of chart to arrange by technology category (less klugey). | |
| 2021年6月5日 (六) 23:00 |  | 1,150 × 600(17 KB) | RCraig09 | Version 3: reduced file size by manually removing "stuff" that Inkscape inserted | |
| 2021年2月22日 (一) 18:55 |  | 1,150 × 600(40 KB) | RCraig09 | Version 2: changed background shading so graph area is white and border is opaque light-gray | |
| 2021年1月30日 (六) 21:46 |  | 1,150 × 600(40 KB) | RCraig09 | Uploaded own work with UploadWizard |
檔案用途
下列頁面有用到此檔案:
全域檔案使用狀況
以下其他 wiki 使用了這個檔案:
- ar.wikipedia.org 的使用狀況
- bn.wikipedia.org 的使用狀況
- bs.wikipedia.org 的使用狀況
- de.wikipedia.org 的使用狀況
- en.wikipedia.org 的使用狀況
- es.wikipedia.org 的使用狀況
- fr.wikipedia.org 的使用狀況
- id.wikipedia.org 的使用狀況
- nl.wikipedia.org 的使用狀況
- pl.wikipedia.org 的使用狀況
- ru.wikipedia.org 的使用狀況
_-_renewable_energy.svg)