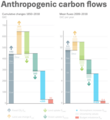
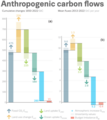
English: This figure shows estimated anthropogenic carbon flows for the Earth system, both as a total amount during years 1850-2018 (left), and as recent annual amounts averaged for years 2009-2018 (right). These flows primarily occur through the emission sources and sinks of carbon dioxide (CO
2), as color-coded and listed at the bottom of the figure.
Cumulative CO2 emissions during years 1850–2018 are estimated at 645±65 gigatonnes carbon (GtC). The largest sources are 440±20 GtC of geologic changes, primarily fossil fuels and cement, and 205±60 GtC of land use changes. The largest sinks are partitioned among the atmosphere (255±5 GtC; 40 %), ocean (160±20 GtC; 25 %), and land (195±40 GtC; 31 %). This cumulative land sink is broadly equal to the cumulative land use source, making global land near neutral over the 1850–2018 period. The use of nearly independent estimates for the individual terms shows a cumulative budget imbalance of 30 GtC (4 %) during 1850–2018.
Annual CO2 emissions during years 2009–2018 are estimated at about 11 GtC. The partitioning of sources and sinks remains similar to the cumulative amounts, with the exception that the relative contribution of the land source is about half the contribution of the land sink in recent years.
Credit:
Friedlingstein, P., Jones, M., O'Sullivan, M., Andrew, R., Hauck, J., Peters, G., Peters, W., Pongratz, J., Sitch, S., Le Quéré, C. and 66 others (2019) "Global carbon budget 2019".
Earth System Science Data,
11(4): 1783–1838.
doi:
10.5194/essd-11-1783-2019.

Material was copied from this source, which is available under a
Creative Commons Attribution 4.0 International License.


