
File:Energyfig.png
無更高解析度可提供。
Energyfig.png (506 × 554 像素,檔案大小:108 KB,MIME 類型:image/png)
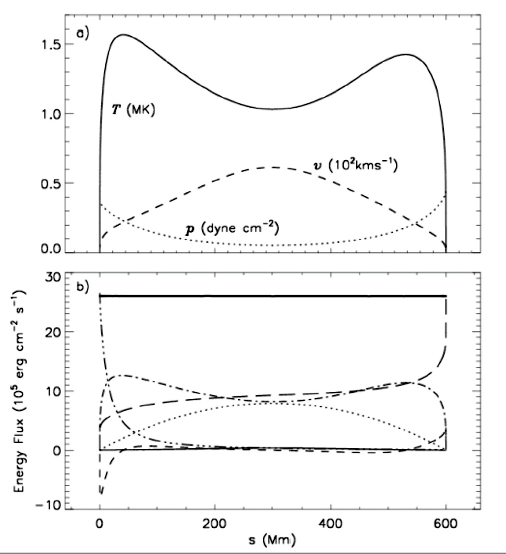
| 描述 | The above figure was produced by Dr Ian O'Neill and Dr Xing Li during research into the energy balance in a long coronal loop (600 million meters long in this example). This is a modelled coronal loop using a full-implicit, 2-fluid numerical method which solves the basic plasma equations simultaneously. In the figure, the top panel shows the plasma parameters along the coronal loop length, where plasma temperature (T in million Kelvin or 106K), velocity (v in 102 kilometers per second) and pressure (p in dyne per cm-2) are displayed. As can be seen, we are dealing with plasma temperatures of over 1.5MK. The lower panel demonstrates the energy sources (kinetic, gravity, enthalpy, wave fluxes) and energy sinks (conduction, radiation fluxes). With reference to the figure, the followeing energy flux corresponds to different traces on the graph: kinetic energy flux (thin solid line), gravitational flux (dotted), radiative flux (long-dash), conductive flux (short-dash), enthalpy flux (dot-dash), wave flux (triple-dot-dash) and the total flux (thick solid line). The total flux must remain constant to confirm steady state. |
| 來源 | English Wikipedia (here) |
| 作者 | These results are published in: O'Neill, I. J. and X. Li, Coronal loops heated by turbulence-driven Alfvén waves: A two fluid model, A&A, 435, pages 1159-1167, 2005 (link to ADS). |
| |
此作品已由其作者,中文維基百科專案的Eeron80,釋出至公有領域。此授權條款在全世界均適用。 如果法律不適用時: |
檔案歷史
點選日期/時間以檢視該時間的檔案版本。
| 日期/時間 | 縮圖 | 尺寸 | 使用者 | 備註 | |
|---|---|---|---|---|---|
| 目前 | 2008年4月29日 (二) 16:54 | | 506 × 554(108 KB) | Henrykus | {{Information |Description=The above figure was produced by [http://www.astroengine.net/astro/projects.shtml Dr Ian O'Neill] and [http://users.aber.ac.uk/xxl Dr Xing Li] during research into the energy balance in a long coronal loop (600 million meters lo |
檔案用途
下列頁面有用到此檔案:
全域檔案使用狀況
以下其他 wiki 使用了這個檔案:
- ca.wikipedia.org 的使用狀況
- en.wikipedia.org 的使用狀況
- sr.wikipedia.org 的使用狀況
- tr.wikipedia.org 的使用狀況
- uk.wikipedia.org 的使用狀況