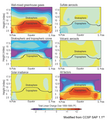
English: From the cited public-domain source - US Global Change Research Program (USGCRP, 2009): "Climate simulations of the vertical profile of temperature change due to various factors, and the effect due to all factors taken together. The panels above represent a cross-section of the atmosphere from the north pole to the south pole, and from the surface up into the stratosphere. The black lines show the location of the tropopause, the boundary between the lower atmosphere (troposphere) and the stratosphere."
This set of climate simulations provides evidence of human-induced climate change. From USGCRP (2009): "Another fingerprint of human effects on climate has been identified by looking at a slice through the layers of the atmosphere, and studying the pattern of temperature changes from the surface up through the stratosphere. In all climate models, increases in carbon dioxide cause warming at the surface and in the troposphere, but lead to cooling of the stratosphere. For straightforward physical reasons, models also calculate that the human-caused depletion of stratospheric ozone has had a strong cooling effect in the stratosphere. There is a good match between the model fingerprint in response to combined carbon dioxide and ozone changes and the observed pattern of tropospheric warming and stratospheric cooling [...]
In contrast, if most of the observed temperature change had been due to an increase in solar output rather than an increase in greenhouse gases, Earth’s atmosphere would have warmed throughout its full vertical extent, including the stratosphere [...] The observed pattern of atmospheric temperature changes, with its pronounced cooling in the stratosphere, is therefore inconsistent with the hypothesis that changes in the Sun can explain the warming of recent decades. Moreover, direct satellite measurements of solar output show slight decreases during the recent period of warming."
References: More details about this image can be found in the following publication: Ramaswamy, V.,
et al., 2006: Figure 1.3, in: Chapter 1: Why do temperatures vary vertically (from the surface to the stratosphere) and what do we understand about why they might vary and change over time? in:
Temperature Trends in the Lower Atmosphere: Steps for Understanding and Reconciling Differences (Karl, T.R.,
et al., (eds.)). Synthesis and Assessment Product 1.1, U.S. Climate Change Science Program, Washington, DC, p.25.


