
File:U.S. Household Debt Relative to Disposable Income and GDP.png
原始檔案 (960 × 720 像素,檔案大小:10 KB,MIME 類型:image/png)
摘要
| 描述 |
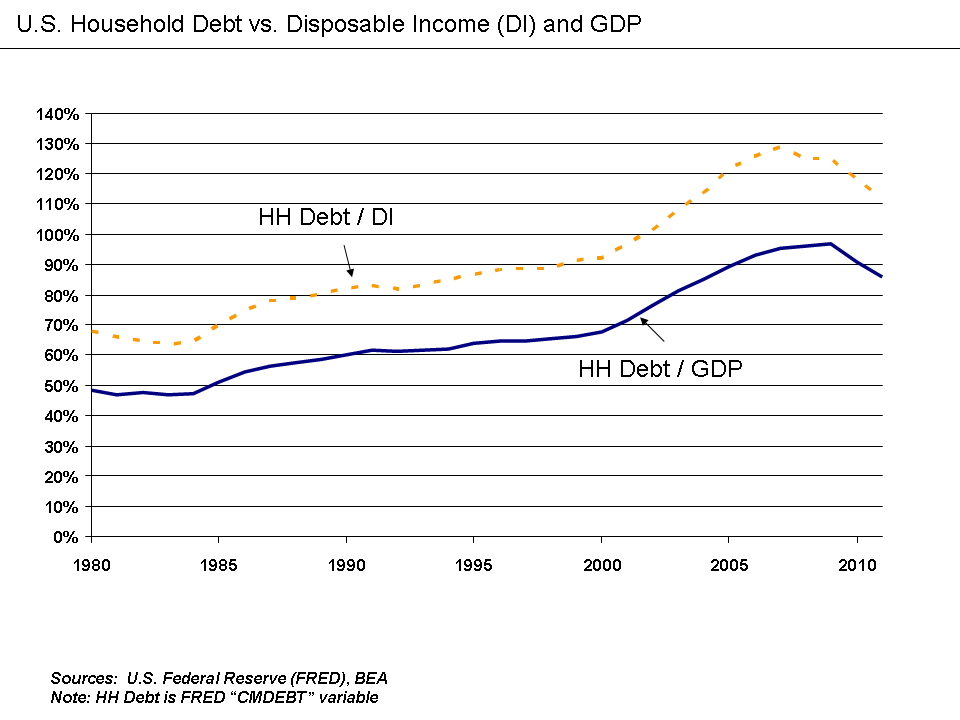
English: U.S. Household Debt Relative to Disposable Income and GDP 1980-2011 |
| 日期 | |
| 來源 | 自己的作品 |
| 作者 | Farcaster |
Understanding the chart
This chart shows how U.S. household (HH) debt (measured by the FRED variable "CMDEBT") rose relative to both GDP and disposable income over the 1980 to 2011 period.
- Household debt as a % disposable income rose from 68% in 1980 to a peak of 128% in 2007, prior to dropping to 112% by 2011.
- Household debt as a % GDP rose from 49% in 1980 to a peak of 97% in 2009, prior to dropping to 86% in 2011.
This chart uses the Federal Reserve Database (FRED) to obtain the CMDEBT variable.[1]
Disposable income data is available from the Bureau of Economic Analysis (BEA).[2]
GDP data is available from the Bureau of Economic Analysis (BEA).[3]
Paul Krugman wrote in December 2010: "The root of our current troubles lies in the debt American families ran up during the Bush-era housing bubble. Twenty years ago, the average American household’s debt was 83 percent of its income; by a decade ago, that had crept up to 92 percent; but by late 2007, debts were 130 percent of income. All this borrowing took place both because banks had abandoned any notion of sound lending and because everyone assumed that house prices would never fall. And then the bubble burst. What we’ve been dealing with ever since is a painful process of “deleveraging”: highly indebted Americans not only can’t spend the way they used to, they’re having to pay down the debts they ran up in the bubble years. This would be fine if someone else were taking up the slack. But what’s actually happening is that some people are spending much less while nobody is spending more — and this translates into a depressed economy and high unemployment. What the government should be doing in this situation is spending more while the private sector is spending less, supporting employment while those debts are paid down. And this government spending needs to be sustained: we’re not talking about a brief burst of aid; we’re talking about spending that lasts long enough for households to get their debts back under control. The original Obama stimulus wasn’t just too small; it was also much too short-lived, with much of the positive effect already gone."[4]
This increase in debt during the period enabled spending that stimulated the economy (arguably hiding the true state of the economy). This debt overhang then began holding back the economy as consumers paid down debt (which reduces economic activity) rather than spend.[5]
During April 2009, U.S. Federal Reserve Vice Chair Janet Yellen discussed the situation: "Once this massive credit crunch hit, it didn’t take long before we were in a recession. The recession, in turn, deepened the credit crunch as demand and employment fell, and credit losses of financial institutions surged. Indeed, we have been in the grips of precisely this adverse feedback loop for more than a year. A process of balance sheet deleveraging has spread to nearly every corner of the economy. Consumers are pulling back on purchases, especially on durable goods, to build their savings. Businesses are cancelling planned investments and laying off workers to preserve cash. And, financial institutions are shrinking assets to bolster capital and improve their chances of weathering the current storm. Once again, Minsky understood this dynamic. He spoke of the paradox of deleveraging, in which precautions that may be smart for individuals and firms—and indeed essential to return the economy to a normal state—nevertheless magnify the distress of the economy as a whole."[6]
References
授權條款

|
已授權您依據自由軟體基金會發行的無固定段落、封面文字和封底文字GNU自由文件授權條款1.2版或任意後續版本,對本檔進行複製、傳播和/或修改。該協議的副本列在GNU自由文件授權條款中。 |
- 您可以自由:
- 分享 – 複製、發佈和傳播本作品
- 重新修改 – 創作演繹作品
- 惟需遵照下列條件:
- 姓名標示 – 您必須指名出正確的製作者,和提供授權條款的連結,以及表示是否有對內容上做出變更。您可以用任何合理的方式來行動,但不得以任何方式表明授權條款是對您許可或是由您所使用。
- 相同方式分享 – 如果您利用本素材進行再混合、轉換或創作,您必須基於如同原先的相同或兼容的條款,來分布您的貢獻成品。
原始上傳日誌
- 2012-07-12 12:49 Farcaster 960×720× (10312 bytes) Uploading a self-made file using [[Wikipedia:File_Upload_Wizard|File Upload Wizard]]
檔案歷史
點選日期/時間以檢視該時間的檔案版本。
| 日期/時間 | 縮圖 | 尺寸 | 用戶 | 備註 | |
|---|---|---|---|---|---|
| 目前 | 2012年7月17日 (二) 13:15 | | 960 × 720(10 KB) | File Upload Bot (Magnus Manske) | Transfered from en.wikipedia by User:Sfan00_IMG using CommonsHelper |
檔案用途
下列頁面有用到此檔案:
全域檔案使用狀況
以下其他 wiki 使用了這個檔案:
- en.wikipedia.org 的使用狀況
- es.wikipedia.org 的使用狀況
- fa.wikipedia.org 的使用狀況
- hy.wikipedia.org 的使用狀況
- it.wikipedia.org 的使用狀況
- ja.wikipedia.org 的使用狀況
- ko.wikipedia.org 的使用狀況
- vi.wikipedia.org 的使用狀況