
File:US timeline. Opioid deaths.jpg

預覽大小:799 × 599 像素。 其他解析度:320 × 240 像素 | 640 × 480 像素 | 1,024 × 768 像素 | 1,280 × 960 像素 | 1,801 × 1,351 像素。
原始檔案 (1,801 × 1,351 像素,檔案大小:152 KB,MIME 類型:image/jpeg)

|
This file may be updated to reflect new information. If you wish to use a specific version of the file without new updates being mirrored, please upload the required version as a separate file. |
摘要
| 描述 |
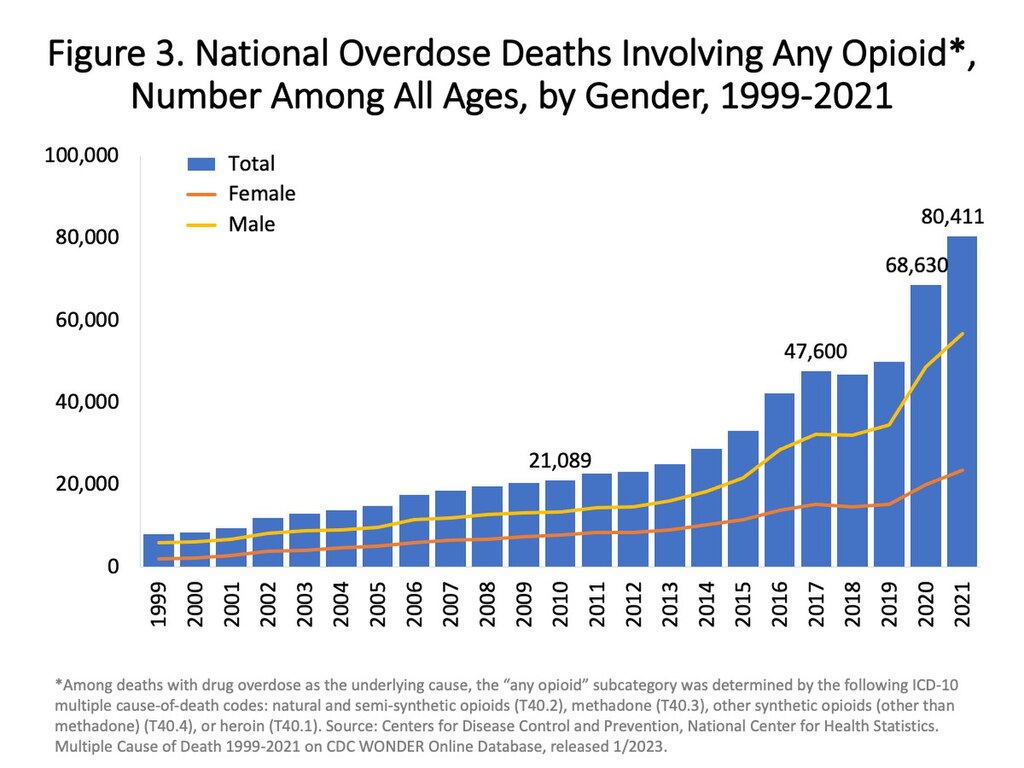
English: From source (emphasis and links added): "Figure 3. National Overdose Deaths Involving Any Opioid—Number Among All Ages, by Gender, 1999-2021. The figure above is a bar and line graph showing the total number of U.S. overdose deaths involving any opioid from 1999 to 2021. Any opioid includes prescription opioids (natural and semi-synthetic opioids and methadone), heroin, and synthetic opioids other than methadone (primarily fentanyl)). Opioid-involved overdose deaths rose from 21,089 in 2010 to 47,600 in 2017 and remained steady through 2019. This was followed by a significant increase in 2020 with 68,630 reported deaths and again in 2021 with 80,411 reported overdose deaths. The bars are overlaid by lines showing the number of deaths by gender from 1999 to 2021 (Source: CDC WONDER). |
||
| 日期 | - date of first upload to the Commons. See file history for dates of later uploads. | ||
| 來源 | Overdose Death Rates. By National Institute on Drug Abuse (NIDA). Click images there to enlarge, and then right-click and "open image in new tab". 1999-2021 chart. 1999-2019 chart. 1999-2017 chart from PDF with larger version of chart. 2002-2017 chart. 2002-2015 chart. | ||
| 作者 | National Institute on Drug Abuse. On some versions of the chart freeware IrfanView was used to crop out the outer white space. And/or edit text at the top, and add a border. See Commons:Convert tables and charts to wiki code or image files, and the section about adding and editing text on chart images. | ||
| 其他版本 |
|


授權條款
This image is a work of the National Institutes of Health, part of the United States Department of Health and Human Services, taken or made as part of an employee's official duties. As a work of the U.S. federal government, the image is in the public domain.
 |
||
| 此作品無已知的著作權限制,亦不受所有相關和鄰接的權利限制。 | ||
檔案歷史
點選日期/時間以檢視該時間的檔案版本。
| 日期/時間 | 縮圖 | 尺寸 | 用戶 | 備註 | |
|---|---|---|---|---|---|
| 目前 | 2024年5月28日 (二) 20:47 | | 1,801 × 1,351(152 KB) | RiverCastle | 2022 update |
| 2023年7月12日 (三) 20:26 |  | 1,200 × 900(179 KB) | Jmabel | uploaded newer version at User:Timeshifter's request | |
| 2021年4月22日 (四) 00:02 |  | 1,118 × 706(146 KB) | Timeshifter | Latest version. | |
| 2019年8月17日 (六) 16:13 |  | 1,341 × 1,037(244 KB) | Timeshifter | Removed outer white space. Added "USA" and border. | |
| 2019年4月26日 (五) 17:19 |  | 1,000 × 750(116 KB) | Natureium | Updated version as of Dec 2018 | |
| 2018年9月5日 (三) 15:54 |  | 806 × 573(88 KB) | Timeshifter | new version | |
| 2017年10月29日 (日) 13:51 |  | 848 × 629(102 KB) | Timeshifter | Newer chart from same source. | |
| 2017年3月27日 (一) 10:07 |  | 849 × 630(104 KB) | Timeshifter | User created page with UploadWizard |
檔案用途
全域檔案使用狀況
以下其他 wiki 使用了這個檔案:
- ar.wikipedia.org 的使用狀況
- azb.wikipedia.org 的使用狀況
- bn.wikipedia.org 的使用狀況
- ca.wikipedia.org 的使用狀況
- cs.wikipedia.org 的使用狀況
- da.wikipedia.org 的使用狀況
- en.wikipedia.org 的使用狀況
- es.wikipedia.org 的使用狀況
- et.wikipedia.org 的使用狀況
- fi.wikipedia.org 的使用狀況
- hy.wikipedia.org 的使用狀況
- sr.wikipedia.org 的使用狀況
- tr.wikipedia.org 的使用狀況
- vi.wikipedia.org 的使用狀況