
File:1951+ Percent of global area at temperature records - Seasonal comparison - NOAA.svg

此 SVG 檔案的 PNG 預覽的大小:800 × 560 像素。 其他解析度:320 × 224 像素 | 640 × 448 像素 | 1,024 × 717 像素 | 1,280 × 896 像素 | 2,560 × 1,792 像素 | 2,000 × 1,400 像素。
原始檔案 (SVG 檔案,表面大小:2,000 × 1,400 像素,檔案大小:22 KB)
摘要
| 描述 |
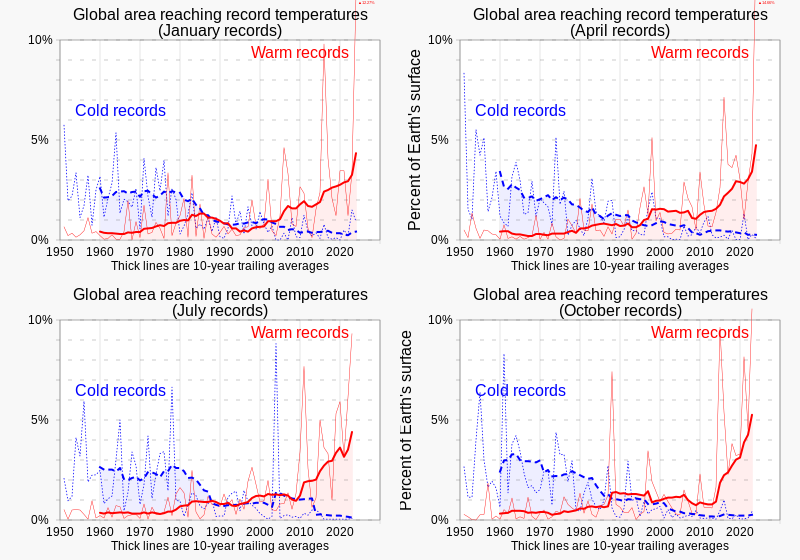
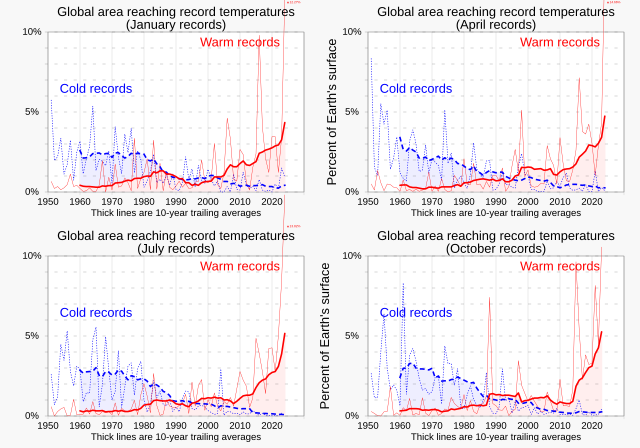
English: Charts comparing percentages of Earth's surface reaching record temperatures since 1951, comparing records for January, April, July and October, from NOAA data.
|
||
| 日期 | |||
| 來源 | 自己的作品 | ||
| 作者 | RCraig09 |

Related files
-
 01 January - Percent of global area at temperature records - Global warming - NOAA.svg
(January data) -
 02 February - Percent of global area at temperature records - Global warming - NOAA.svg
(February data) -
 03 March - Percent of global area at temperature records - Global warming - NOAA.svg
(March data) -
 04 April - Percent of global area at temperature records - Global warming - NOAA.svg
(April data) -
 05 May - Percent of global area at temperature records - Global warming - NOAA.svg
(May data) -
 06 June - Percent of global area at temperature records - Global warming - NOAA.svg
(June data)


-
 07 July - Percent of global area at temperature records - Global warming - NOAA.svg
(July data) -
 08 August - Percent of global area at temperature records - Global warming - NOAA.svg
(August data) -
 09 September - Percent of global area at temperature records - Global warming - NOAA.svg
(September data) -
 10 October - Percent of global area at temperature records - Global warming - NOAA.svg
(October data) -
 11 November - Percent of global area at temperature records - Global warming - NOAA.svg
(November data) -
 12 December - Percent of global area at temperature records - Global warming - NOAA.svg
(December data)


-
 1951+ Percent of global area at temperature records - Seasonal comparison - NOAA.svg
Seasonal comparison -
 1951 - Percent of global area at temperature records (monthly) - Global warming - NOAA.svg
All months scatterplot/dot plot -
 1951- RATIO of new record warm temperatures to new record cold temperatures (monthly) - Global warming.svg
Ratios scatterplot/dot plot (monthly) -
 1951- Percent of record temperatures that are cold or warm records.svg
 -
 1951- Warm and cold record temperatures - bar chart.svg

_-_Global_warming_-_NOAA.svg)
_-_Global_warming.svg)


授權條款
我,本作品的著作權持有者,決定用以下授權條款發佈本作品:
此檔案採用創用CC 姓名標示-相同方式分享 4.0 國際授權條款。
- 您可以自由:
- 分享 – 複製、發佈和傳播本作品
- 重新修改 – 創作演繹作品
- 惟需遵照下列條件:
- 姓名標示 – 您必須指名出正確的製作者,和提供授權條款的連結,以及表示是否有對內容上做出變更。您可以用任何合理的方式來行動,但不得以任何方式表明授權條款是對您許可或是由您所使用。
- 相同方式分享 – 如果您利用本素材進行再混合、轉換或創作,您必須基於如同原先的相同或兼容的條款,來分布您的貢獻成品。
檔案歷史
點選日期/時間以檢視該時間的檔案版本。
| 日期/時間 | 縮圖 | 尺寸 | 使用者 | 備註 | |
|---|---|---|---|---|---|
| 目前 | 2024年5月17日 (五) 04:20 | | 2,000 × 1,400(22 KB) | RCraig09 | Version 8: update to include new chart for April 2024 |
| 2024年2月24日 (六) 00:23 |  | 2,000 × 1,400(23 KB) | RCraig09 | Version 7: Update to include chart showing data for January 2024 | |
| 2023年11月16日 (四) 05:38 |  | 2,000 × 1,400(24 KB) | RCraig09 | Version 6: remove minor extraneous characters from October quadrant | |
| 2023年11月16日 (四) 05:34 |  | 2,000 × 1,400(24 KB) | RCraig09 | Version 5: Update with October 2023 chart | |
| 2023年8月15日 (二) 03:57 |  | 2,000 × 1,400(26 KB) | RCraig09 | Version 4: update to include July chart through 2023 | |
| 2023年7月30日 (日) 21:08 |  | 2,000 × 1,400(27 KB) | RCraig09 | Version 3: Add April and October graphics, for four-season comparison | |
| 2023年7月29日 (六) 04:00 | 2,000 × 700(13 KB) | RCraig09 | Version 2: re-centering some text strings | ||
| 2023年7月28日 (五) 22:37 | 2,000 × 700(13 KB) | RCraig09 | Uploaded own work with UploadWizard |
檔案用途
下列頁面有用到此檔案:
全域檔案使用狀況
以下其他 wiki 使用了這個檔案:
- ar.wikipedia.org 的使用狀況
- bn.wikipedia.org 的使用狀況
- cs.wikipedia.org 的使用狀況
- en.wikipedia.org 的使用狀況
- ha.wikipedia.org 的使用狀況
- id.wikipedia.org 的使用狀況
- mk.wikipedia.org 的使用狀況