
File:2005onion and shallot.PNG

本预览的尺寸:800 × 351像素。 其他分辨率:320 × 140像素 | 640 × 281像素 | 1,425 × 625像素。
原始文件 (1,425 × 625像素,文件大小:61 KB,MIME类型:image/png)
摘要
| 描述 |
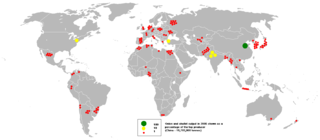
This bubble map shows the global distribution of onion and shallot output in 2005 as a percentage of the top producer (China - 19,793,000 tonnes). This map is consistent with incomplete set of data too as long as the top producer is known. It resolves the accessibility issues faced by colour-coded maps that may not be properly rendered in old computer screens. Data was extracted on 11th June 2007 from http://faostat.fao.org/site/336/DesktopDefault.aspx?PageID=336 Based on en:Image:BlankMap-World.png |
| 日期 | 2007年6月11日 (原始上传日期) |
| 来源 | 本檔案是從en.wikipedia轉移到維基共享資源。 |
| 作者 | 英语维基百科的Anwar saadat |

|
此economic map图片可使用矢量图形重新创建为SVG文件。这具有很多好处;更多信息请参见共享资源:待清理媒体。如果存在此图片的SVG格式,请将其上传,然后将此模板替换为
{{vector version available|新图片名称}}。
建议您将SVG命名为“2005onion and shallot.svg”,这样在使用Vector version available(或Vva)模板时就不需要填写新图片名称参数。 |
许可协议
| 本作品已被作者英语维基百科的Anwar saadat释出到公有领域。这适用于全世界。 在一些国家这可能不合法;如果是这样的话,那么: Anwar saadat无条件地授予任何人以任何目的使用本作品的权利,除非这些条件是法律规定所必需的。 |
原始上传日志
原始描述頁面位於這裡。下列使用者名稱均來自en.wikipedia。
- 2007-06-11 16:04 Anwar saadat 1425×625×8 (62405 bytes)
文件历史
点击某个日期/时间查看对应时刻的文件。
| 日期/时间 | 缩略图 | 大小 | 用户 | 备注 | |
|---|---|---|---|---|---|
| 当前 | 2007年8月11日 (六) 14:00 | | 1,425 × 625(61 KB) | Windupduck | {{Information |Description=This bubble map shows the global distribution of onion and shallot output in 2005 as a percentage of the top producer (China - 19,793,000 tonnes). This map is consistent with incomplete set of data too as long as the top produc |
文件用途
没有页面链接到本图像。
全域文件用途
以下其他wiki使用此文件:
- af.wikipedia.org上的用途
- ast.wikipedia.org上的用途
- cs.wikipedia.org上的用途
- es.wikipedia.org上的用途
- fa.wikipedia.org上的用途
- fr.wikipedia.org上的用途
- he.wikipedia.org上的用途
- is.wikipedia.org上的用途
- it.wikipedia.org上的用途
- ko.wikipedia.org上的用途
- my.wikipedia.org上的用途
- oc.wikipedia.org上的用途
- pl.wikipedia.org上的用途
- si.wikipedia.org上的用途
- ta.wikipedia.org上的用途
- th.wikipedia.org上的用途
- uk.wikipedia.org上的用途
- ur.wikipedia.org上的用途
- vi.wikipedia.org上的用途