
File:20190912 Stacked warming stripes - atmospheric layers (derived from Ed Hawkins).png

本预览的尺寸:800 × 465像素。 其他分辨率:320 × 186像素 | 640 × 372像素 | 1,024 × 595像素 | 1,280 × 744像素 | 2,560 × 1,488像素 | 4,116 × 2,392像素。
原始文件 (4,116 × 2,392像素,文件大小:122 KB,MIME类型:image/png)
.png?uselang=zh)
.png?uselang=zh)
.png?action=history&uselang=zh)
.png)
摘要
| 描述 |
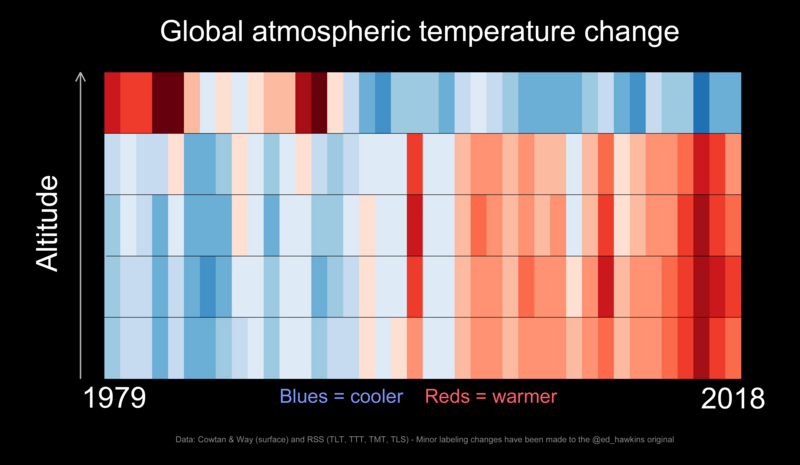
English: Stacked warming stripes data visualization by Ed Hawkins (scientist), showing changes in temperature in different layers of earth's atmosphere (1979- )
General notes:
|
| 日期 | |
| 来源 | Hawkins, Ed, Atmospheric temperature trends. Climate Lab Book (12 September 2019). Archived from the original on 12 September 2019. |
| 作者 | Ed Hawkins (scientist), climate scientist at the University of Reading |
}}
许可协议
本文件采用知识共享署名-相同方式共享 4.0 国际许可协议授权。
- 您可以自由地:
- 共享 – 复制、发行并传播本作品
- 修改 – 改编作品
- 惟须遵守下列条件:
- 署名 – 您必须对作品进行署名,提供授权条款的链接,并说明是否对原始内容进行了更改。您可以用任何合理的方式来署名,但不得以任何方式表明许可人认可您或您的使用。
- 相同方式共享 – 如果您再混合、转换或者基于本作品进行创作,您必须以与原先许可协议相同或相兼容的许可协议分发您贡献的作品。
文件历史
点击某个日期/时间查看对应时刻的文件。
| 日期/时间 | 缩略图 | 大小 | 用户 | 备注 | |
|---|---|---|---|---|---|
| 当前 | 2023年9月16日 (六) 05:18 | | 4,116 × 2,392(122 KB) | RCraig09 | Version 2: reduce file size at tinypng.com |
| 2019年9月12日 (四) 19:39 |  | 4,116 × 2,392(168 KB) | RCraig09 | User created page with UploadWizard |
文件用途
以下页面使用本文件:
全域文件用途
以下其他wiki使用此文件:
- en.wikipedia.org上的用途
- fr.wikipedia.org上的用途
.png)