File:Oxygenation-atm-2.svg

此SVG文件的PNG预览的大小:800 × 390像素。 其他分辨率:320 × 156像素 | 640 × 312像素 | 1,024 × 500像素 | 1,280 × 625像素 | 2,560 × 1,250像素 | 840 × 410像素。
原始文件 (SVG文件,尺寸为840 × 410像素,文件大小:40 KB)
文件历史
点击某个日期/时间查看对应时刻的文件。
| 日期/时间 | 缩略图 | 大小 | 用户 | 备注 | |
|---|---|---|---|---|---|
| 当前 | 2024年2月14日 (三) 13:07 |  | 840 × 410(40 KB) | Alfa-ketosav | File uploaded using svgtranslate tool (https://svgtranslate.toolforge.org/). Added translation for hu. |
| 2022年11月12日 (六) 19:22 |  | 840 × 410(29 KB) | Hugo | File uploaded using svgtranslate tool (https://svgtranslate.toolforge.org/). Added translation for cs. | |
| 2011年1月22日 (六) 16:34 |  | 840 × 410(24 KB) | Loudubewe | removing of false graph legend | |
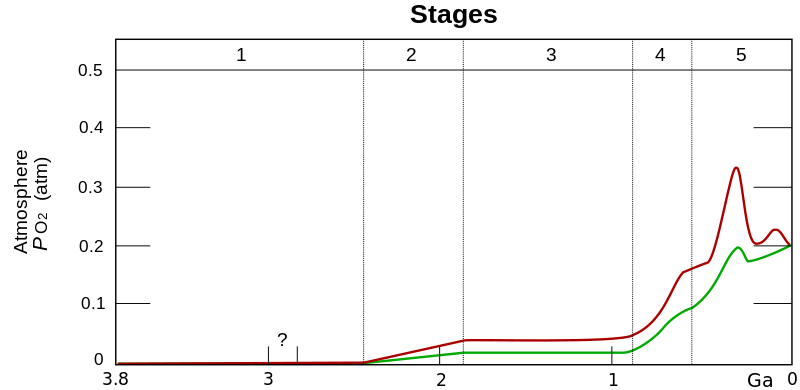
| 2011年1月22日 (六) 16:13 |  | 840 × 410(25 KB) | Loudubewe | {{Information |Description={{en|1=Estimated evolution of atmospheric <math> P_{{O_{{2}}}}</math> in the shallow (red line) and deep (green line) oceans. The stages are: stage 1 (3.85–2.45Gyr ago (Ga)), stage 2 (2.45–1.85Ga), stage 3 (1.85–0.85Ga), S |
文件用途
以下4个页面使用本文件:
全域文件用途
以下其他wiki使用此文件:
- af.wikipedia.org上的用途
- ar.wikipedia.org上的用途
- az.wikipedia.org上的用途
- bn.wikipedia.org上的用途
- ca.wikipedia.org上的用途
- cs.wikipedia.org上的用途
- da.wikipedia.org上的用途
- de.wikipedia.org上的用途
- en.wikipedia.org上的用途
- es.wikipedia.org上的用途
- et.wikipedia.org上的用途
- fr.wikipedia.org上的用途
- gl.wikipedia.org上的用途
- hu.wikipedia.org上的用途
- id.wikipedia.org上的用途
- ko.wikipedia.org上的用途
- nl.wikipedia.org上的用途
- pt.wikipedia.org上的用途
- simple.wikipedia.org上的用途
- si.wikipedia.org上的用途
- test.wikipedia.org上的用途
- te.wikipedia.org上的用途
- tl.wikipedia.org上的用途
- uk.wikipedia.org上的用途
- vi.wikipedia.org上的用途
- www.wikidata.org上的用途


