File:20200314 Temperature changes for three latitude bands (5MA, 1880- ) GISS.svg

頁面內容不支援其他語言。
這個檔案來自維基共享資源
維基百科,自由的百科全書

原始檔案(SVG 檔案,表面大小:1,000 × 643 像素,檔案大小:72 KB)


摘要

描述
English: Graphs of average temperature changes for three latitude bands, 1880- , 5-year smoothed.

Data source:

— Archive:
https://web.archive.org/web/20200315170007/https://data.giss.nasa.gov/gistemp/graphs_v4/graph_data/Temperature_Change_for_Three_Latitude_Bands/graph.txt (or?)
https://web.archive.org/web/20200315170008/https://data.giss.nasa.gov/gistemp/graphs_v4/graph_data/Temperature_Change_for_Three_Latitude_Bands/graph.txt

Description from source:

  • "Annual and five-year lowess smoothed temperature changes, with the base period 1951-1980, for three latitude bands that cover 30%, 40% and 30% of the global area. Uncertainty bars (95% confidence limits) for the annual (outer) and five-year smooth (inner) are based on a spatial sampling analysis. These estimates use land and ocean data. [This is an update of Figure 5 in Hansen et al. (1999).]"

Notes on this file itself:

  • NASA GISS csv --> Excel chart --> export to PDF --> import to Inkscape --> create Inkscape SVG and upload to Wikimedia
  • For localization: SVG file has a hidden layer with actual text objects. I duplicated the text objects, converted them into 'paths' in Inkscape, and made the paths visible. To translated to another language, you may delete the present 'paths', perform the translation in the hidden text objects, and repeat my duplication and convert-to-path steps.
日期
來源 自己的作品
作者 RCraig09

Actual data

Click at right to show/hide actual data used to make the chart

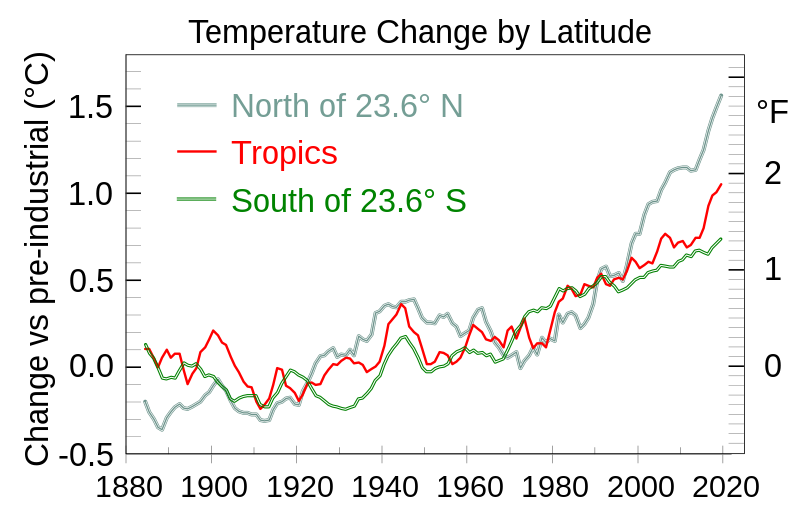
To the right of Year, the first three columns are the annual data from NASA GISS, and the last three columns are the five-year-averaged data. Field names like "24N-90N" denote boundaries of latitude bands.

Year 24N-90N 24S-24N 90S-24S N-5MA Tropic-5MA S-5MA
1880 -0.35 -0.12 -0.01
1881 -0.32 0.11 -0.07
1882 -0.28 -0.04 0.01
1883 -0.33 -0.16 -0.01
1884 -0.6 -0.14 -0.14 -0.376 -0.070 -0.044
1885 -0.63 -0.12 -0.27 -0.432 -0.070 -0.096
1886 -0.54 -0.18 -0.21 -0.476 -0.128 -0.124
1887 -0.5 -0.28 -0.28 -0.520 -0.176 -0.182
1888 -0.4 0.11 -0.29 -0.534 -0.122 -0.238
1889 -0.27 0.09 -0.17 -0.468 -0.076 -0.244
1890 -0.45 -0.36 -0.23 -0.432 -0.124 -0.236
1891 -0.41 -0.06 -0.22 -0.406 -0.100 -0.238
1892 -0.42 -0.28 -0.08 -0.390 -0.100 -0.198
1893 -0.5 -0.35 -0.05 -0.410 -0.192 -0.150
1894 -0.31 -0.32 -0.24 -0.418 -0.274 -0.164
1895 -0.38 -0.06 -0.26 -0.404 -0.214 -0.170
1896 -0.34 0.11 -0.15 -0.390 -0.180 -0.156
1897 -0.34 0.18 -0.24 -0.374 -0.088 -0.188
1898 -0.32 -0.21 -0.27 -0.338 -0.060 -0.232
1899 -0.22 -0.11 -0.19 -0.320 -0.018 -0.222
1900 -0.19 0.19 -0.3 -0.282 0.032 -0.230
1901 -0.16 -0.02 -0.31 -0.246 0.006 -0.262
1902 -0.53 -0.03 -0.35 -0.284 -0.036 -0.284
1903 -0.46 -0.28 -0.39 -0.312 -0.050 -0.308
1904 -0.5 -0.45 -0.44 -0.368 -0.118 -0.358
1905 -0.4 -0.07 -0.36 -0.410 -0.170 -0.370
1906 -0.25 -0.19 -0.24 -0.428 -0.204 -0.356
1907 -0.58 -0.3 -0.29 -0.438 -0.258 -0.344
1908 -0.47 -0.43 -0.36 -0.440 -0.288 -0.338
1909 -0.53 -0.47 -0.44 -0.446 -0.292 -0.338
1910 -0.41 -0.48 -0.38 -0.448 -0.374 -0.342
1911 -0.42 -0.41 -0.48 -0.482 -0.418 -0.390
1912 -0.59 -0.17 -0.37 -0.484 -0.392 -0.406
1913 -0.44 -0.26 -0.35 -0.478 -0.358 -0.404
1914 -0.24 -0.06 -0.18 -0.420 -0.276 -0.352
1915 -0.23 -0.01 -0.22 -0.384 -0.182 -0.320
1916 -0.37 -0.45 -0.23 -0.374 -0.190 -0.270
1917 -0.5 -0.63 -0.19 -0.356 -0.282 -0.234
1918 -0.41 -0.33 -0.14 -0.350 -0.296 -0.192
1919 -0.43 -0.2 -0.22 -0.388 -0.324 -0.200
1920 -0.25 -0.25 -0.32 -0.392 -0.372 -0.220
1921 0.01 -0.25 -0.31 -0.316 -0.332 -0.236
1922 -0.25 -0.32 -0.28 -0.266 -0.270 -0.254
1923 -0.15 -0.3 -0.34 -0.214 -0.264 -0.294
1924 -0.13 -0.26 -0.44 -0.154 -0.276 -0.338
1925 -0.04 -0.24 -0.38 -0.112 -0.274 -0.350
1926 0.03 0.01 -0.4 -0.108 -0.222 -0.368
1927 -0.13 -0.16 -0.39 -0.084 -0.190 -0.390
1928 -0.07 -0.15 -0.39 -0.068 -0.160 -0.400
1929 -0.38 -0.28 -0.46 -0.118 -0.164 -0.404
1930 0.04 -0.11 -0.42 -0.102 -0.138 -0.412
1931 0.01 0.08 -0.43 -0.106 -0.124 -0.418
1932 0.03 -0.17 -0.35 -0.074 -0.126 -0.410
1933 -0.24 -0.28 -0.34 -0.108 -0.152 -0.400
1934 0.17 -0.26 -0.26 0.002 -0.148 -0.360
1935 -0.05 -0.19 -0.38 -0.016 -0.164 -0.352
1936 -0.03 -0.13 -0.3 -0.024 -0.206 -0.326
1937 0.2 -0.06 -0.22 0.010 -0.184 -0.300
1938 0.39 -0.23 -0.1 0.136 -0.174 -0.252
1939 0.22 -0.12 -0.12 0.146 -0.146 -0.224
1940 0.11 0.28 -0.07 0.178 -0.052 -0.162
1941 0.01 0.49 -0.05 0.186 0.072 -0.112
1942 0.13 0.08 -0.01 0.172 0.100 -0.070
1943 0.37 -0.09 0.04 0.168 0.128 -0.042
1944 0.38 0.18 0.05 0.200 0.188 -0.008
1945 0.11 0.16 -0.03 0.200 0.164 0.000
1946 0.06 -0.05 -0.24 0.210 0.056 -0.038
1947 0.15 -0.07 -0.16 0.214 0.026 -0.068
1948 0.12 -0.19 -0.24 0.164 0.006 -0.124
1949 0.11 -0.19 -0.23 0.110 -0.068 -0.180
1950 -0.05 -0.29 -0.14 0.078 -0.158 -0.202
1951 0.08 -0.06 -0.23 0.082 -0.160 -0.200
1952 0.11 0.01 -0.09 0.074 -0.144 -0.186
1953 0.35 0.07 -0.18 0.120 -0.092 -0.174
1954 0.07 -0.21 -0.22 0.112 -0.096 -0.172
1955 0.04 -0.34 -0.06 0.130 -0.106 -0.156
1956 -0.2 -0.33 0 0.074 -0.160 -0.110
1957 0.03 0.08 0.02 0.058 -0.146 -0.088
1958 0.08 0.2 -0.14 0.004 -0.120 -0.080
1959 0.16 0.07 -0.15 0.022 -0.064 -0.066
1960 0.09 0.02 -0.19 0.032 0.008 -0.092
1961 0.19 -0.03 0.06 0.110 0.068 -0.080
1962 0.24 -0.05 -0.06 0.152 0.042 -0.096
1963 0.14 0.12 -0.12 0.164 0.026 -0.092
1964 -0.23 -0.14 -0.25 0.086 -0.016 -0.112
1965 -0.19 -0.03 -0.14 0.030 -0.026 -0.102
1966 -0.14 0.08 -0.16 -0.036 -0.004 -0.146
1967 0.12 -0.14 -0.01 -0.060 -0.022 -0.136
1968 -0.11 -0.07 -0.08 -0.110 -0.060 -0.128
1969 -0.29 0.34 0.03 -0.122 0.036 -0.072
1970 -0.11 0.07 0.1 -0.106 0.056 -0.024
1971 -0.06 -0.26 0.12 -0.090 -0.012 0.032
1972 -0.34 0.17 0.14 -0.182 0.050 0.062
1973 0.11 0.19 0.18 -0.138 0.102 0.114
1974 -0.14 -0.2 0.17 -0.108 -0.006 0.142
1975 0.12 -0.24 0.15 -0.062 -0.068 0.152
1976 -0.26 -0.11 0.08 -0.102 -0.038 0.144
1977 0.14 0.16 0.25 -0.006 -0.040 0.166
1978 -0.03 0.08 0.16 -0.034 -0.062 0.162
1979 -0.03 0.26 0.23 -0.012 0.030 0.174
1980 0.06 0.31 0.39 -0.024 0.140 0.222
1981 0.48 0.18 0.35 0.124 0.198 0.276
1982 -0.08 0.27 0.18 0.080 0.220 0.262
1983 0.22 0.43 0.23 0.130 0.290 0.276
1984 0.02 0.18 0.25 0.140 0.274 0.280
1985 -0.03 0.09 0.29 0.122 0.230 0.260
1986 0.11 0.23 0.2 0.048 0.240 0.230
1987 0.04 0.58 0.25 0.072 0.302 0.244
1988 0.4 0.37 0.38 0.108 0.290 0.274
1989 0.41 0.13 0.33 0.186 0.280 0.290
1990 0.63 0.37 0.37 0.318 0.336 0.306
1991 0.47 0.36 0.39 0.390 0.362 0.344
1992 0.1 0.28 0.26 0.402 0.302 0.346
1993 0.13 0.32 0.22 0.348 0.292 0.314
1994 0.43 0.31 0.2 0.352 0.328 0.288
1995 0.7 0.42 0.22 0.366 0.338 0.258
1996 0.23 0.32 0.43 0.318 0.330 0.266
1997 0.53 0.51 0.33 0.404 0.376 0.280
1998 0.78 0.69 0.33 0.534 0.450 0.302
1999 0.7 0.2 0.31 0.588 0.428 0.324
2000 0.7 0.24 0.29 0.588 0.392 0.338
2001 0.8 0.42 0.43 0.702 0.412 0.338
2002 0.83 0.59 0.47 0.762 0.428 0.366
2003 0.84 0.64 0.38 0.774 0.418 0.376
2004 0.73 0.55 0.34 0.780 0.488 0.382
2005 1.02 0.62 0.42 0.844 0.564 0.408
2006 0.99 0.56 0.4 0.882 0.592 0.402
2007 1.13 0.46 0.45 0.942 0.566 0.398
2008 0.92 0.37 0.39 0.958 0.512 0.400
2009 0.78 0.68 0.5 0.968 0.538 0.432
2010 1.03 0.68 0.47 0.970 0.550 0.442
2011 0.99 0.37 0.54 0.970 0.512 0.470
2012 1.04 0.53 0.4 0.952 0.526 0.460
2013 0.95 0.58 0.55 0.958 0.568 0.492
2014 1.07 0.67 0.52 1.016 0.566 0.496
2015 1.31 0.96 0.4 1.072 0.622 0.482
2016 1.55 1.01 0.49 1.184 0.750 0.472
2017 1.39 0.82 0.59 1.254 0.808 0.510
2018 1.25 0.68 0.68 1.314 0.828 0.536
2019 1.42 0.9 0.65 1.384 0.874 0.562


授權條款

我,本作品的著作權持有者,決定用以下授權條款發佈本作品:
w:zh:創用CC
姓名標示 相同方式分享
您可以自由:
  • 分享 – 複製、發佈和傳播本作品
  • 重新修改 – 創作演繹作品
惟需遵照下列條件:
  • 姓名標示 – 您必須指名出正確的製作者,和提供授權條款的連結,以及表示是否有對內容上做出變更。您可以用任何合理的方式來行動,但不得以任何方式表明授權條款是對您許可或是由您所使用。
  • 相同方式分享 – 如果您利用本素材進行再混合、轉換或創作,您必須基於如同原先的相同或兼容的條款,來分布您的貢獻成品。

說明

添加單行說明來描述出檔案所代表的內容
Graphs of average temperature changes for three latitude bands, 1880- , 5-year smoothed.

在此檔案描寫的項目

描繪內容

全球變暖 中文 (已轉換拼寫)

檔案來源 Chinese (Taiwan) (已轉換拼寫)

image/svg+xml

673193df58d05eebbd8be8afe571abbe63804caf

斷定方法:​SHA-1 中文 (已轉換拼寫)

73,339 位元組

643 像素

1,000 像素

檔案歷史

點選日期/時間以檢視該時間的檔案版本。

日期/時間縮⁠圖尺寸使用者備⁠註
目前2020年8月26日 (三) 20:14於 2020年8月26日 (三) 20:14 版本的縮圖1,000 × 643(72 KB)RCraig09Version 6: Add Fahrenheit scale at right
2020年3月23日 (一) 18:36於 2020年3月23日 (一) 18:36 版本的縮圖960 × 643(65 KB)EfbrazilMade design consistent with other graph showing temperature change by location
2020年3月21日 (六) 20:22於 2020年3月21日 (六) 20:22 版本的縮圖2,000 × 1,500(229 KB)RCraig09Version 4: Changed legend: "Tr" to "T". Moved time axis up. Added minor explanatory text to tiny text in lower right.
2020年3月15日 (日) 16:55於 2020年3月15日 (日) 16:55 版本的縮圖2,000 × 1,500(230 KB)RCraig09Version 3: Updated with GISS data for 2019. Changing of central legends.
2020年3月15日 (日) 03:06於 2020年3月15日 (日) 03:06 版本的縮圖2,000 × 1,500(214 KB)RCraig09Version 2: Add extra layer of text that has been converted to "paths" (vectors) in Inkscape, to avoid gross rendering issues in Version 1. . . . Adding reference period in tiny text in lower right.
2020年3月14日 (六) 22:17於 2020年3月14日 (六) 22:17 版本的縮圖2,000 × 1,500(57 KB)RCraig09Uploaded own work with UploadWizard

下列頁面有用到此檔案:

全域檔案使用狀況

以下其他 wiki 使用了這個檔案:

詮釋資料