
File:Carbon cycle-cute diagram zh-hant.svg

此 SVG 檔案的 PNG 預覽的大小:540 × 417 像素。 其他解析度:311 × 240 像素 | 622 × 480 像素 | 995 × 768 像素 | 1,280 × 988 像素 | 2,560 × 1,977 像素。
原始檔案 (SVG 檔案,表面大小:540 × 417 像素,檔案大小:339 KB)
摘要
| 描述 |
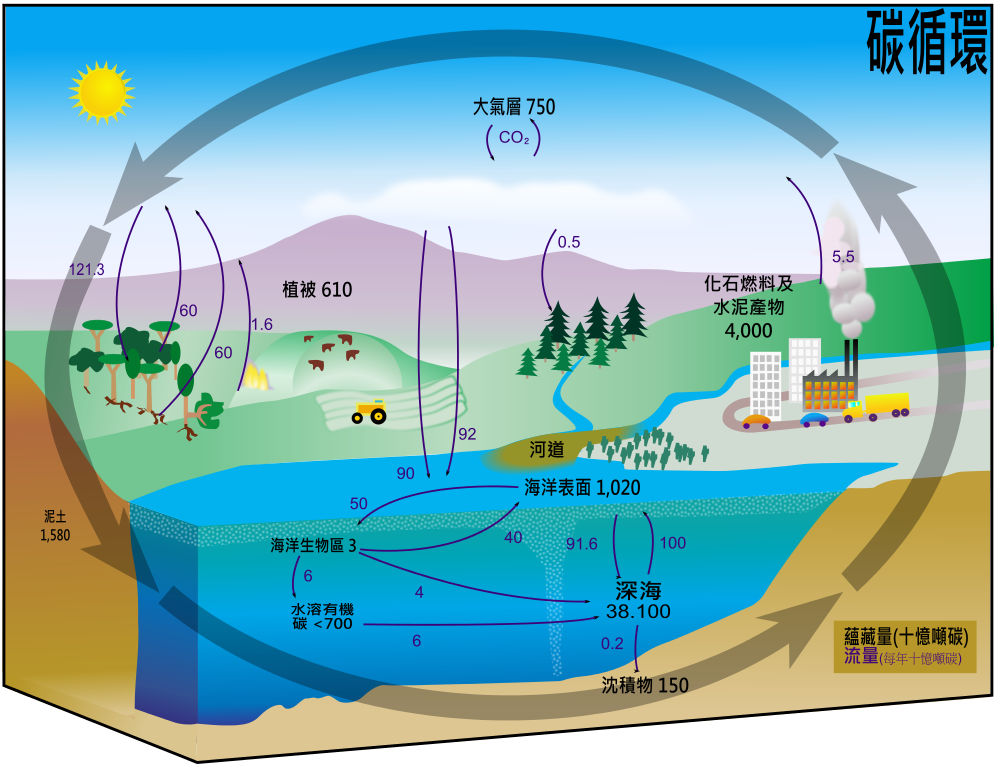
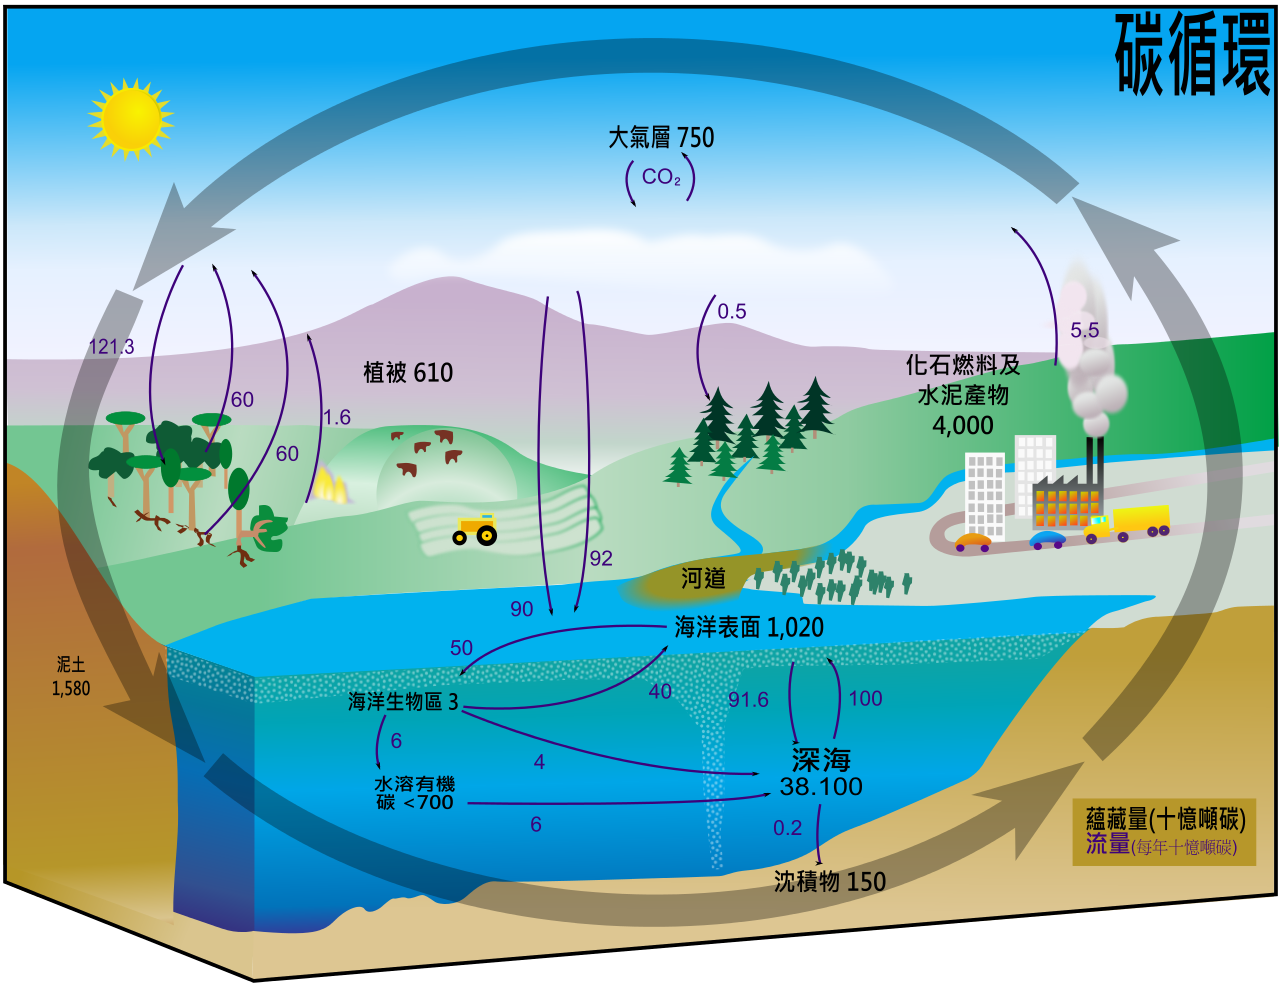
English: This carbon cycle diagram shows the storage and annual exchange of carbon between the atmosphere, hydrosphere and geosphere in gigatons - or billions of tons - of Carbon (GtC). Burning fossil fuels by people adds about 5.5 GtC of carbon per year into the atmosphere.
中文(臺灣):碳循環圖,展示碳蘊藏量及每年碳在大氣層、水界及陸界之間的流動,以十億噸碳計算。燃燒化石燃料,每年就為大氣層增加大約五十五億噸碳。 |
| 日期 | |
| 來源 | File:Carbon cycle-cute diagram.svg |
| 作者 | J.Wong |
| 其他版本 |
[] Single-language versions
|


授權條款
| 我,此作品的版權所有人,釋出此作品至公共領域。此授權條款在全世界均適用。 這可能在某些國家不合法,如果是的話: 我授予任何人有權利使用此作品於任何用途,除受法律約束外,不受任何限制。 |
檔案歷史
點選日期/時間以檢視該時間的檔案版本。
| 日期/時間 | 縮圖 | 尺寸 | 用戶 | 備註 | |
|---|---|---|---|---|---|
| 目前 | 2009年2月19日 (四) 16:27 | | 540 × 417(339 KB) | Wong128hk | {{Information |Description={{en|1=This carbon cycle diagram shows the storage and annual exchange of carbon between the atmosphere, hydrosphere and geosphere in gigatons - or billions of tons - of Carbon (GtC). Burning fossil fuels by people adds about 5. |