
File:2012-2013 Australian region cyclone season summary.png

預覽大小:800 × 571 像素。 其他解析度:320 × 229 像素 | 640 × 457 像素 | 1,024 × 731 像素 | 1,280 × 914 像素 | 2,560 × 1,828 像素 | 4,000 × 2,857 像素。
原始檔案 (4,000 × 2,857 像素,檔案大小:5.55 MB,MIME 類型:image/png)
| 描述 |
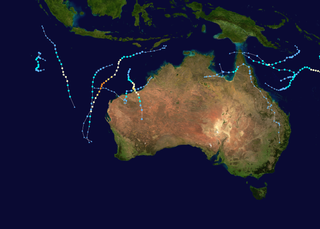
English: This map shows the tracks of all tropical cyclones in the 2012-13 Australian region cyclone season. The points show the location of each storm at 6-hour intervals. The colour represents the storm's maximum sustained wind speeds as classified in the Saffir-Simpson Hurricane Scale (see below), and the shape of the data points represent the type of the storm.
Tropical depression (≤38 mph, ≤62 km/h)
Tropical storm (39–73 mph, 63–118 km/h)
Category 1 (74–95 mph, 119–153 km/h)
Category 2 (96–110 mph, 154–177 km/h)
Category 3 (111–129 mph, 178–208 km/h)
Category 4 (130–156 mph, 209–251 km/h)
Category 5 (≥157 mph, ≥252 km/h)
Unknown
Storm type |
| 來源 | Created using Wikipedia:WikiProject Tropical cyclones/Tracks. The background image is from NASA [1]. The tracking data is from the Joint Typhoon Warning Center's best track database |
| 作者 | Keith Edkins |
| 此作品已由其作者,Keith Edkins,釋出至公有領域。此授權條款在全世界均適用。 這可能在某些國家不合法,如果是的話: Keith Edkins授予任何人有權利使用此作品於任何用途,除受法律約束外,不受任何限制。 |
檔案歷史
點選日期/時間以檢視該時間的檔案版本。
| 日期/時間 | 縮圖 | 尺寸 | 使用者 | 備註 | |
|---|---|---|---|---|---|
| 目前 | 2020年4月8日 (三) 02:38 | | 4,000 × 2,857(5.55 MB) | Supportstorm | Best track update, rm minor systems without best track data |
| 2013年5月4日 (六) 15:04 |  | 3,000 × 1,854(3.1 MB) | Keith Edkins | Added Zane | |
| 2013年4月14日 (日) 08:15 |  | 3,000 × 1,854(3.09 MB) | Keith Edkins | Also added the late March inland Tropical Low | |
| 2013年4月14日 (日) 08:08 |  | 3,000 × 1,854(3.09 MB) | Keith Edkins | Added 15U and Victoria | |
| 2013年3月19日 (二) 08:07 |  | 3,000 × 1,854(3.06 MB) | Keith Edkins | Added Australian part of Sandra, and Tim | |
| 2013年3月7日 (四) 08:42 |  | 3,000 × 1,854(3.04 MB) | Keith Edkins | Added Rusty and 11U | |
| 2013年1月27日 (日) 09:20 |  | 3,000 × 1,854(3.02 MB) | Keith Edkins | Added Oswald and Peta | |
| 2013年1月15日 (二) 08:16 |  | 3,000 × 1,854(3 MB) | Keith Edkins | Add Narelle and part of TD (90S) | |
| 2013年1月3日 (四) 09:46 |  | 3,000 × 1,854(2.98 MB) | Keith Edkins | == {{int:filedesc}} == {{Information |Description={{en|Track map of all storms in the 2012–13 Australian region cyclone season. The points show the location of the storm at 6-hour intervals. The colour... |
檔案用途
下列頁面有用到此檔案:
全域檔案使用狀況
以下其他 wiki 使用了這個檔案:
- de.wikipedia.org 的使用狀況
- en.wikipedia.org 的使用狀況
- ko.wikipedia.org 的使用狀況