
File:Annual population growth rate by U.S. state.svg

原始檔案 (SVG 檔案,表面大小:1,199 × 593 像素,檔案大小:75 KB)

|
該圖像需要長期保持更新。如果有需要請更新該圖像。
|
摘要
| 描述 |
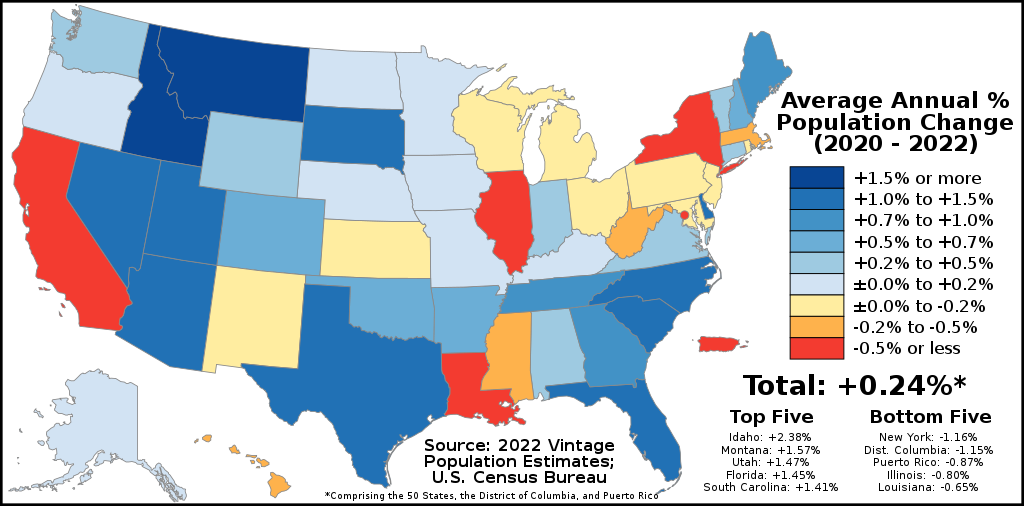
English: The map above shows the average annual resident population growth rate of each U.S. state, the District of Columbia, and Puerto Rico according to the latest official estimates, which is currently the 2022 Vintage Population Estimates. Results can be found here.
The timeframe used for this map will always be between the most recent official population estimates and the most recent official U.S. Census results (or in the case that the most recent official population estimates date to a census year, then the census before that one). So currently, the timeframe for this map goes from the 2020 United States Census resident populations to the 2022 Vintage Population Estimates. This file should next be updated when the 2023 Vintage Population Estimates are released on the statewide level, currently expected to occur in December 2023. The timeframe of this map will then be switched from "2020 - 2022" to "2020 - 2023". Average Annual Growth Rates are used instead of the total percentage growth rate since the last census for consistency and to prevent a new legend from being used every single year. Legend +1.5% or more
+1.0% to +1.5%
+0.7% to +1.0%
+0.5% to +0.7%
+0.2% to +0.5%
±0.0% to +0.2%
±0.0% to -0.2%
-0.2% to -0.5%
-0.5% or less |
| 日期 | |
| 來源 | 自己的作品 |
| 作者 | Abbasi786786 |
授權條款
- 您可以自由:
- 分享 – 複製、發佈和傳播本作品
- 重新修改 – 創作演繹作品
- 惟需遵照下列條件:
- 姓名標示 – 您必須指名出正確的製作者,和提供授權條款的連結,以及表示是否有對內容上做出變更。您可以用任何合理的方式來行動,但不得以任何方式表明授權條款是對您許可或是由您所使用。
- 相同方式分享 – 如果您利用本素材進行再混合、轉換或創作,您必須基於如同原先的相同或兼容的條款,來分布您的貢獻成品。
檔案歷史
點選日期/時間以檢視該時間的檔案版本。
| 日期/時間 | 縮圖 | 尺寸 | 使用者 | 備註 | |
|---|---|---|---|---|---|
| 目前 | 2022年12月22日 (四) 21:30 | | 1,199 × 593(75 KB) | Abbasi786786 | Update to 2022 |
| 2022年11月19日 (六) 16:11 |  | 1,199 × 593(72 KB) | Yann | Reverted to version as of 16:55, 21 December 2021 (UTC) | |
| 2022年11月18日 (五) 14:57 |  | 1,199 × 593(72 KB) | Italyoz484 | Inaccurate | |
| 2021年12月21日 (二) 16:55 |  | 1,199 × 593(72 KB) | Abbasi786786 | Update 2021 | |
| 2021年8月16日 (一) 00:19 |  | 1,199 × 593(72 KB) | Abbasi786786 | Added Outlines | |
| 2021年5月9日 (日) 21:32 |  | 1,099 × 593(90 KB) | Abbasi786786 | New legend | |
| 2021年4月27日 (二) 18:56 |  | 1,099 × 593(89 KB) | Abbasi786786 | Updated to 2020 U.S. Census Resident Population (2010 Census - 2020 Census average annual growth rate goes) | |
| 2021年3月28日 (日) 15:15 |  | 1,099 × 593(89 KB) | Abbasi786786 | Color Scheme | |
| 2021年3月26日 (五) 21:51 |  | 1,099 × 593(89 KB) | Abbasi786786 | Fixed Hawaii | |
| 2021年3月25日 (四) 19:52 |  | 1,099 × 593(89 KB) | Abbasi786786 | Better Source |
檔案用途
下列頁面有用到此檔案:
全域檔案使用狀況
以下其他 wiki 使用了這個檔案:
- en.wikipedia.org 的使用狀況
- pt.wikipedia.org 的使用狀況
- ru.wikipedia.org 的使用狀況
- uk.wikipedia.org 的使用狀況
- uz.wikipedia.org 的使用狀況